|
Download Data (XLS File) |
|
||||||||
|
||||||||
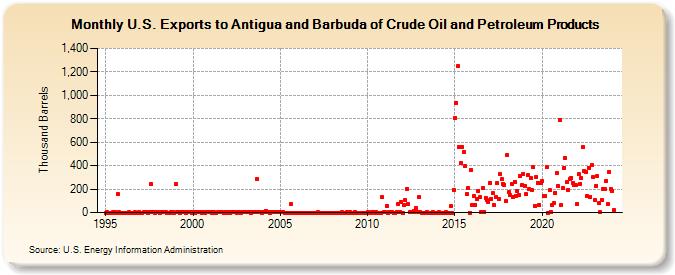
| U.S. Exports to Antigua and Barbuda of Crude Oil and Petroleum Products (Thousand Barrels) | ||||||||
| Year | Jan | Feb | Mar | Apr | May | Jun | Jul | Aug | Sep | Oct | Nov | Dec |
|---|---|---|---|---|---|---|---|---|---|---|---|---|
| 1995 | 0 | 1 | 0 | 0 | 0 | 1 | 1 | 0 | 159 | 1 | 0 | 0 |
| 1996 | 0 | 0 | 0 | 0 | 1 | 0 | 0 | 0 | 1 | 0 | 0 | 1 |
| 1997 | 0 | 0 | 1 | 1 | 1 | 0 | 1 | 242 | 2 | 1 | 0 | 1 |
| 1998 | 1 | 0 | 1 | 2 | 1 | 1 | 0 | 0 | 0 | 1 | 1 | 0 |
| 1999 | 241 | 1 | 1 | 0 | 1 | 1 | 1 | 0 | 1 | 1 | 1 | 0 |
| 2000 | 1 | 0 | 1 | 1 | 1 | 1 | 0 | 1 | 0 | 1 | 1 | 1 |
| 2001 | 1 | 0 | 2 | 0 | 0 | 1 | 1 | 1 | 1 | 0 | 1 | 0 |
| 2002 | 2 | 0 | 3 | 1 | 1 | 2 | 0 | 2 | 1 | 0 | 3 | 3 |
| 2003 | 1 | 4 | 1 | 1 | 0 | 2 | 1 | 1 | 282 | 2 | 1 | 0 |
| 2004 | 1 | 2 | 17 | 1 | 1 | 0 | 1 | 1 | 1 | 2 | 1 | 2 |
| 2005 | 3 | 1 | 1 | 0 | 0 | 0 | 0 | 70 | 0 | 0 | 0 | 0 |
| 2006 | 0 | 0 | 0 | 0 | 0 | 0 | 0 | 0 | 0 | 0 | 0 | |
| 2007 | 0 | 0 | 1 | 0 | 0 | 0 | 0 | 0 | 0 | 0 | 0 | |
| 2008 | 0 | 0 | 0 | 0 | 0 | 0 | 1 | 0 | 0 | 0 | 5 | 0 |
| 2009 | 1 | 0 | 0 | 5 | 0 | 0 | 0 | 0 | 0 | 0 | 0 | 0 |
| 2010 | 1 | 0 | 0 | 8 | 5 | 0 | 1 | 0 | 0 | 0 | 130 | 1 |
| 2011 | 1 | 58 | 0 | 1 | 1 | 4 | 0 | 0 | 5 | 70 | 3 | 88 |
| 2012 | 0 | 68 | 107 | 201 | 71 | 1 | 1 | 2 | 16 | 35 | 1 | 132 |
| 2013 | 1 | 0 | 0 | 0 | 0 | 3 | 0 | 0 | 0 | 4 | 0 | 0 |
| 2014 | 0 | 2 | 0 | 0 | 0 | 0 | 3 | 0 | 0 | 53 | 0 | 194 |
| 2015 | 810 | 936 | 1,249 | 555 | 419 | 557 | 517 | 394 | 156 | 208 | 0 | 365 |
| 2016 | 61 | 145 | 66 | 112 | 187 | 129 | 1 | 208 | 6 | 127 | 104 | 88 |
| 2017 | 255 | 118 | 165 | 64 | 129 | 248 | 118 | 326 | 283 | 245 | 238 | 98 |
| 2018 | 491 | 172 | 149 | 246 | 135 | 264 | 142 | 185 | 150 | 314 | 232 | 330 |
| 2019 | 229 | 155 | 317 | 199 | 293 | 192 | 386 | 56 | 303 | 256 | 64 | 255 |
| 2020 | 268 | 137 | 141 | 386 | 0 | 189 | 8 | 66 | 81 | 170 | 335 | 225 |
| 2021 | 788 | 63 | 206 | 383 | 465 | 257 | 195 | 286 | 298 | 249 | 231 | 231 |
| 2022 | 71 | 325 | 246 | 293 | 555 | 354 | 348 | 142 | 383 | 136 | 402 | 301 |
| 2023 | 105 | 229 | 311 | 81 | 1 | 111 | 201 | 205 | 267 | 72 | 347 | 201 |
| 2024 | 186 | 21 | ||||||||||
| - = No Data Reported; -- = Not Applicable; NA = Not Available; W = Withheld to avoid disclosure of individual company data. |
| Release Date: 4/30/2024 |
| Next Release Date: 5/31/2024 |