|
Download Data (XLS File) |
|
||||||||
|
||||||||
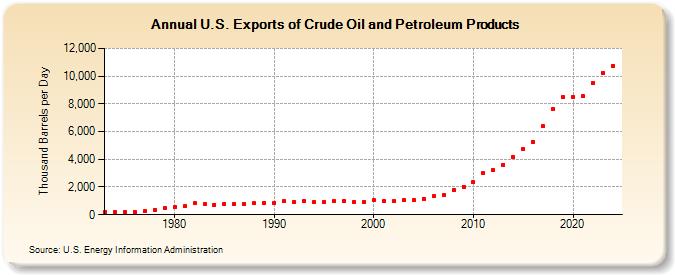
| U.S. Exports of Crude Oil and Petroleum Products (Thousand Barrels per Day) | ||||||||
| Decade | Year-0 | Year-1 | Year-2 | Year-3 | Year-4 | Year-5 | Year-6 | Year-7 | Year-8 | Year-9 |
|---|---|---|---|---|---|---|---|---|---|---|
| 1970's | 231 | 221 | 209 | 223 | 243 | 362 | 471 | |||
| 1980's | 544 | 595 | 815 | 739 | 722 | 781 | 785 | 764 | 815 | 859 |
| 1990's | 857 | 1,001 | 950 | 1,003 | 942 | 949 | 981 | 1,003 | 945 | 940 |
| 2000's | 1,040 | 971 | 984 | 1,027 | 1,048 | 1,165 | 1,317 | 1,433 | 1,802 | 2,024 |
| 2010's | 2,353 | 2,986 | 3,205 | 3,621 | 4,176 | 4,738 | 5,261 | 6,376 | 7,601 | 8,471 |
| 2020's | 8,498 | 8,536 | 9,520 | 10,150 |
| - = No Data Reported; -- = Not Applicable; NA = Not Available; W = Withheld to avoid disclosure of individual company data. |
| Release Date: 3/29/2024 |
| Next Release Date: 8/30/2024 |