|
Download Data (XLS File) |
|
||||||||
|
||||||||
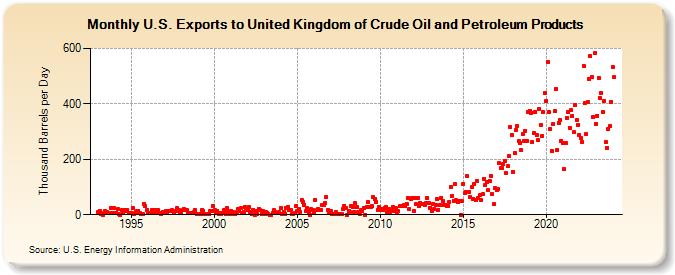
| U.S. Exports to United Kingdom of Crude Oil and Petroleum Products (Thousand Barrels per Day) | ||||||||
| Year | Jan | Feb | Mar | Apr | May | Jun | Jul | Aug | Sep | Oct | Nov | Dec |
|---|---|---|---|---|---|---|---|---|---|---|---|---|
| 1993 | 11 | 15 | 1 | 0 | 6 | 12 | 9 | 5 | 6 | 24 | 6 | 23 |
| 1994 | 5 | 7 | 19 | 1 | 0 | 17 | 5 | 17 | 14 | 18 | 7 | 7 |
| 1995 | 7 | 25 | 2 | 11 | 14 | 14 | 6 | 1 | 3 | 40 | 30 | 18 |
| 1996 | 7 | 7 | 5 | 18 | 6 | 16 | 6 | 16 | 7 | 1 | 6 | 8 |
| 1997 | 5 | 14 | 7 | 13 | 12 | 16 | 13 | 6 | 14 | 24 | 16 | 9 |
| 1998 | 8 | 17 | 21 | 17 | 17 | 7 | 6 | 7 | 5 | 8 | 17 | 3 |
| 1999 | 2 | 3 | 1 | 18 | 14 | 3 | 1 | 4 | 2 | 14 | 13 | 33 |
| 2000 | 17 | 10 | 15 | 1 | 7 | 1 | 5 | 16 | 1 | 26 | 12 | 2 |
| 2001 | 15 | 10 | 2 | 1 | 9 | 20 | 13 | 23 | 7 | 10 | 27 | 23 |
| 2002 | 16 | 28 | 11 | 1 | 18 | 0 | 12 | 3 | 21 | 16 | 4 | 13 |
| 2003 | 1 | 9 | 7 | 1 | 0 | 0 | 6 | 16 | 11 | 6 | 6 | 8 |
| 2004 | 25 | 3 | 11 | 4 | 23 | 28 | 17 | 18 | 1 | 1 | 7 | 32 |
| 2005 | 13 | 19 | 9 | 53 | 47 | 36 | 12 | 24 | 8 | 0 | 19 | 16 |
| 2006 | 9 | 53 | 16 | 22 | 18 | 16 | 34 | 35 | 42 | 63 | 17 | 9 |
| 2007 | 12 | 3 | 4 | 1 | 8 | 1 | 2 | 1 | 2 | 19 | 33 | 24 |
| 2008 | 0 | 14 | 9 | 32 | 29 | 10 | 41 | 29 | 9 | 1 | 17 | 15 |
| 2009 | 25 | 0 | 29 | 45 | 27 | 29 | 30 | 63 | 57 | 45 | 18 | 29 |
| 2010 | 16 | 21 | 18 | 26 | 28 | 10 | 21 | 11 | 13 | 29 | 15 | 23 |
| 2011 | 7 | 12 | 30 | 32 | 32 | 34 | 31 | 40 | 59 | 19 | 56 | 62 |
| 2012 | 13 | 59 | 37 | 62 | 30 | 43 | 38 | 37 | 34 | 42 | 61 | 43 |
| 2013 | 26 | 15 | 39 | 20 | 35 | 55 | 18 | 35 | 62 | 51 | 36 | 36 |
| 2014 | 30 | 32 | 45 | 101 | 69 | 51 | 110 | 52 | 45 | 48 | 0 | 49 |
| 2015 | 111 | 79 | 83 | 139 | 83 | 65 | 99 | 58 | 112 | 53 | 123 | 60 |
| 2016 | 70 | 52 | 74 | 130 | 108 | 117 | 89 | 123 | 139 | 73 | 37 | 95 |
| 2017 | 89 | 93 | 187 | 167 | 170 | 184 | 195 | 152 | 175 | 211 | 316 | 288 |
| 2018 | 155 | 223 | 305 | 319 | 265 | 260 | 233 | 291 | 267 | 303 | 267 | 372 |
| 2019 | 375 | 368 | 263 | 293 | 372 | 286 | 269 | 383 | 322 | 285 | 371 | 439 |
| 2020 | 411 | 552 | 369 | 310 | 230 | 327 | 373 | 455 | 234 | 332 | 340 | 267 |
| 2021 | 258 | 165 | 258 | 350 | 370 | 314 | 377 | 356 | 297 | 397 | 342 | 323 |
| 2022 | 289 | 275 | 263 | 537 | 404 | 290 | 406 | 491 | 571 | 496 | 351 | 582 |
| 2023 | 323 | 425 | 577 | 450 | 437 | 447 | 491 | 266 | 237 | 311 | 319 | 426 |
| 2024 | 533 | 495 | 352 | 532 | 270 | 351 | ||||||
| - = No Data Reported; -- = Not Applicable; NA = Not Available; W = Withheld to avoid disclosure of individual company data. |
| Release Date: 8/30/2024 |
| Next Release Date: 9/30/2024 |