|
Download Data (XLS File) |
|
||||||||
|
||||||||
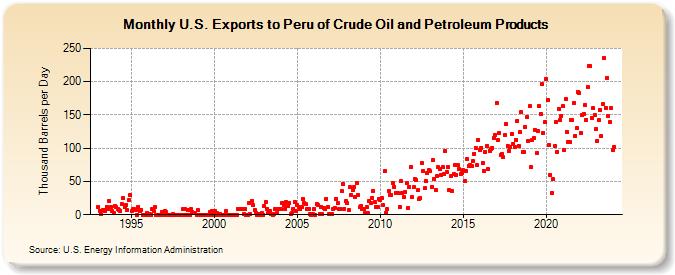
| U.S. Exports to Peru of Crude Oil and Petroleum Products (Thousand Barrels per Day) | ||||||||
| Year | Jan | Feb | Mar | Apr | May | Jun | Jul | Aug | Sep | Oct | Nov | Dec |
|---|---|---|---|---|---|---|---|---|---|---|---|---|
| 1993 | 12 | 6 | 1 | 7 | 7 | 6 | 12 | 9 | 20 | 12 | 5 | 2 |
| 1994 | 13 | 11 | 9 | 7 | 6 | 16 | 25 | 11 | 15 | 7 | 22 | 29 |
| 1995 | 5 | 8 | 8 | 7 | 0 | 12 | 6 | 7 | 0 | 0 | 0 | 3 |
| 1996 | 0 | 1 | 0 | 9 | 5 | 11 | 0 | 0 | 0 | 0 | 4 | 0 |
| 1997 | 6 | 4 | 0 | 0 | 0 | 0 | 1 | 0 | 0 | 0 | 0 | 0 |
| 1998 | 0 | 8 | 0 | 8 | 0 | 7 | 0 | 8 | 4 | 2 | 2 | 0 |
| 1999 | 7 | 0 | 0 | 0 | 0 | 0 | 0 | 0 | 0 | 4 | 6 | 0 |
| 2000 | 6 | 0 | 2 | 0 | 1 | 0 | 0 | 0 | 5 | 0 | 0 | 0 |
| 2001 | 0 | 0 | 0 | 0 | 0 | 9 | 8 | 9 | 9 | 1 | 9 | 0 |
| 2002 | 0 | 18 | 1 | 21 | 14 | 7 | 3 | 0 | 1 | 0 | 2 | 0 |
| 2003 | 13 | 19 | 9 | 3 | 6 | 1 | 0 | 1 | 8 | 2 | 9 | 9 |
| 2004 | 9 | 18 | 15 | 8 | 19 | 13 | 18 | 1 | 2 | 9 | 19 | 5 |
| 2005 | 15 | 11 | 8 | 11 | 24 | 17 | 16 | 9 | 9 | 1 | 0 | 1 |
| 2006 | 9 | 0 | 16 | 14 | 1 | 12 | 1 | 10 | 9 | 24 | 12 | 1 |
| 2007 | 1 | 1 | 9 | 10 | 24 | 17 | 8 | 9 | 35 | 46 | 9 | 20 |
| 2008 | 17 | 7 | 41 | 30 | 37 | 42 | 26 | 48 | 30 | 11 | 13 | 9 |
| 2009 | 9 | 3 | 11 | 2 | 21 | 18 | 25 | 36 | 19 | 12 | 12 | 24 |
| 2010 | 22 | 25 | 14 | 65 | 3 | 8 | 36 | 30 | 30 | 47 | 42 | 33 |
| 2011 | 32 | 32 | 12 | 50 | 32 | 26 | 34 | 47 | 10 | 42 | 72 | 26 |
| 2012 | 41 | 53 | 52 | 37 | 24 | 25 | 78 | 65 | 40 | 50 | 62 | 67 |
| 2013 | 65 | 42 | 82 | 54 | 37 | 58 | 71 | 69 | 59 | 71 | 61 | 96 |
| 2014 | 64 | 71 | 37 | 58 | 36 | 61 | 74 | 60 | 74 | 68 | 61 | 63 |
| 2015 | 67 | 51 | 66 | 83 | 73 | 75 | 73 | 80 | 92 | 101 | 75 | 113 |
| 2016 | 98 | 101 | 78 | 66 | 94 | 104 | 68 | 96 | 99 | 101 | 116 | 120 |
| 2017 | 168 | 112 | 123 | 90 | 92 | 86 | 120 | 136 | 104 | 96 | 102 | 122 |
| 2018 | 107 | 102 | 113 | 141 | 104 | 124 | 154 | 95 | 94 | 132 | 147 | 111 |
| 2019 | 163 | 71 | 113 | 115 | 128 | 93 | 126 | 163 | 152 | 196 | 123 | 139 |
| 2020 | 204 | 173 | 105 | 60 | 33 | 53 | 103 | 140 | 95 | 159 | 143 | 149 |
| 2021 | 163 | 97 | 174 | 125 | 110 | 110 | 143 | 142 | 168 | 119 | 130 | 185 |
| 2022 | 183 | 123 | 150 | 152 | 165 | 143 | 192 | 224 | 223 | 146 | 160 | 150 |
| 2023 | 129 | 111 | 142 | 158 | 118 | 166 | 236 | 161 | 206 | 148 | 139 | 160 |
| 2024 | 97 | |||||||||||
| - = No Data Reported; -- = Not Applicable; NA = Not Available; W = Withheld to avoid disclosure of individual company data. |
| Release Date: 3/29/2024 |
| Next Release Date: 4/30/2024 |