|
Download Data (XLS File) |
|
||||||||
|
||||||||
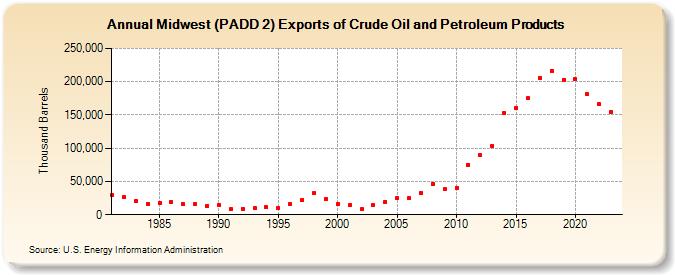
| Midwest (PADD 2) Exports of Crude Oil and Petroleum Products (Thousand Barrels) | ||||||||
| Decade | Year-0 | Year-1 | Year-2 | Year-3 | Year-4 | Year-5 | Year-6 | Year-7 | Year-8 | Year-9 |
|---|---|---|---|---|---|---|---|---|---|---|
| 1980's | 29,238 | 26,269 | 20,307 | 16,657 | 17,825 | 18,735 | 15,597 | 15,665 | 13,159 | |
| 1990's | 14,648 | 7,873 | 8,762 | 9,541 | 11,191 | 10,142 | 15,705 | 22,607 | 32,545 | 23,316 |
| 2000's | 16,193 | 14,305 | 7,939 | 13,860 | 19,796 | 24,678 | 24,471 | 32,661 | 46,299 | 37,902 |
| 2010's | 40,579 | 75,210 | 89,370 | 102,645 | 153,252 | 160,198 | 175,054 | 205,868 | 216,470 | 203,163 |
| 2020's | 203,852 | 180,992 | 165,962 | 154,150 |
| - = No Data Reported; -- = Not Applicable; NA = Not Available; W = Withheld to avoid disclosure of individual company data. |
| Release Date: 3/29/2024 |
| Next Release Date: 8/30/2024 |