|
Download Data (XLS File) |
|
||||||||
|
||||||||
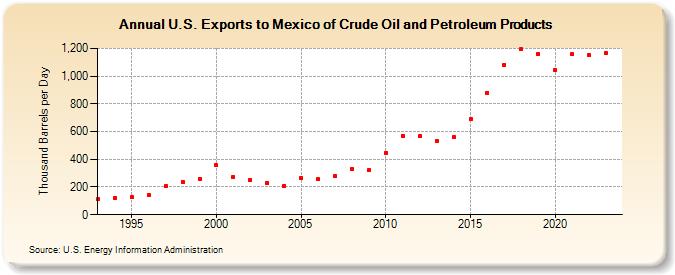
| U.S. Exports to Mexico of Crude Oil and Petroleum Products (Thousand Barrels per Day) | ||||||||
| Decade | Year-0 | Year-1 | Year-2 | Year-3 | Year-4 | Year-5 | Year-6 | Year-7 | Year-8 | Year-9 |
|---|---|---|---|---|---|---|---|---|---|---|
| 1990's | 110 | 124 | 125 | 143 | 207 | 235 | 261 | |||
| 2000's | 358 | 274 | 254 | 228 | 209 | 268 | 255 | 279 | 333 | 322 |
| 2010's | 448 | 570 | 565 | 532 | 559 | 690 | 880 | 1,081 | 1,194 | 1,158 |
| 2020's | 1,042 | 1,156 | 1,152 | 1,165 |
| - = No Data Reported; -- = Not Applicable; NA = Not Available; W = Withheld to avoid disclosure of individual company data. |
| Release Date: 3/29/2024 |
| Next Release Date: 8/30/2024 |