|
Download Data (XLS File) |
|
||||||||
|
||||||||
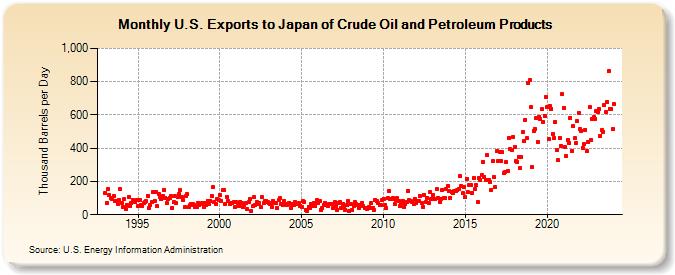
| U.S. Exports to Japan of Crude Oil and Petroleum Products (Thousand Barrels per Day) | ||||||||
| Year | Jan | Feb | Mar | Apr | May | Jun | Jul | Aug | Sep | Oct | Nov | Dec |
|---|---|---|---|---|---|---|---|---|---|---|---|---|
| 1993 | 131 | 72 | 154 | 118 | 102 | 97 | 115 | 81 | 85 | 67 | 87 | 152 |
| 1994 | 73 | 49 | 95 | 35 | 61 | 109 | 51 | 71 | 87 | 81 | 77 | 91 |
| 1995 | 55 | 89 | 58 | 55 | 69 | 74 | 80 | 113 | 42 | 61 | 76 | 139 |
| 1996 | 81 | 138 | 50 | 126 | 108 | 94 | 114 | 149 | 103 | 70 | 96 | 102 |
| 1997 | 114 | 42 | 74 | 111 | 71 | 108 | 127 | 146 | 105 | 86 | 45 | 110 |
| 1998 | 123 | 46 | 58 | 62 | 62 | 58 | 45 | 48 | 73 | 59 | 66 | 69 |
| 1999 | 44 | 71 | 57 | 85 | 65 | 84 | 113 | 166 | 78 | 67 | 92 | 91 |
| 2000 | 119 | 85 | 146 | 148 | 65 | 108 | 80 | 64 | 72 | 69 | 76 | 47 |
| 2001 | 74 | 68 | 52 | 79 | 73 | 46 | 56 | 70 | 34 | 76 | 94 | 21 |
| 2002 | 52 | 105 | 60 | 77 | 63 | 72 | 44 | 104 | 69 | 80 | 83 | 74 |
| 2003 | 71 | 64 | 46 | 84 | 69 | 70 | 41 | 86 | 99 | 62 | 57 | 84 |
| 2004 | 62 | 61 | 66 | 71 | 39 | 66 | 59 | 77 | 62 | 62 | 71 | 54 |
| 2005 | 47 | 82 | 78 | 31 | 22 | 49 | 42 | 62 | 53 | 71 | 51 | 89 |
| 2006 | 73 | 84 | 31 | 38 | 57 | 72 | 57 | 53 | 65 | 64 | 64 | 38 |
| 2007 | 74 | 53 | 31 | 72 | 75 | 41 | 66 | 47 | 31 | 56 | 81 | 21 |
| 2008 | 63 | 29 | 53 | 75 | 62 | 60 | 43 | 59 | 69 | 52 | 39 | 41 |
| 2009 | 37 | 47 | 40 | 69 | 39 | 29 | 87 | 80 | 68 | 57 | 58 | 87 |
| 2010 | 97 | 58 | 41 | 98 | 140 | 96 | 93 | 100 | 65 | 91 | 98 | 80 |
| 2011 | 55 | 68 | 84 | 49 | 63 | 79 | 145 | 86 | 84 | 76 | 62 | 96 |
| 2012 | 70 | 82 | 83 | 110 | 71 | 48 | 120 | 79 | 102 | 71 | 136 | 95 |
| 2013 | 116 | 92 | 93 | 152 | 102 | 78 | 92 | 151 | 102 | 100 | 155 | 174 |
| 2014 | 142 | 101 | 137 | 128 | 144 | 145 | 146 | 155 | 230 | 172 | 129 | 165 |
| 2015 | 104 | 214 | 134 | 178 | 177 | 133 | 220 | 156 | 177 | 75 | 222 | 209 |
| 2016 | 237 | 318 | 228 | 210 | 359 | 208 | 196 | 151 | 322 | 226 | 165 | 383 |
| 2017 | 323 | 379 | 323 | 377 | 249 | 256 | 316 | 264 | 463 | 393 | 390 | 468 |
| 2018 | 407 | 323 | 318 | 350 | 279 | 344 | 495 | 443 | 572 | 459 | 789 | 807 |
| 2019 | 646 | 284 | 505 | 516 | 580 | 440 | 589 | 574 | 633 | 558 | 595 | 709 |
| 2020 | 650 | 454 | 655 | 637 | 486 | 460 | 560 | 390 | 326 | 463 | 416 | 724 |
| 2021 | 641 | 407 | 351 | 451 | 431 | 584 | 384 | 532 | 459 | 431 | 562 | 613 |
| 2022 | 514 | 505 | 400 | 426 | 511 | 382 | 437 | 646 | 448 | 576 | 586 | 578 |
| 2023 | 621 | 619 | 633 | 476 | 507 | 500 | 658 | 618 | 678 | 863 | 636 | 636 |
| 2024 | 515 | |||||||||||
| - = No Data Reported; -- = Not Applicable; NA = Not Available; W = Withheld to avoid disclosure of individual company data. |
| Release Date: 3/29/2024 |
| Next Release Date: 4/30/2024 |