|
Download Data (XLS File) |
|
||||||||
|
||||||||
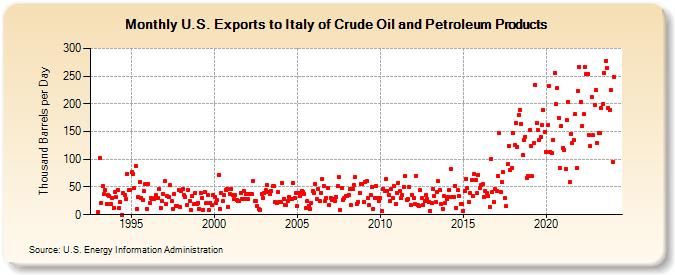
| U.S. Exports to Italy of Crude Oil and Petroleum Products (Thousand Barrels per Day) | ||||||||
| Year | Jan | Feb | Mar | Apr | May | Jun | Jul | Aug | Sep | Oct | Nov | Dec |
|---|---|---|---|---|---|---|---|---|---|---|---|---|
| 1993 | 4 | 102 | 22 | 51 | 37 | 45 | 19 | 35 | 34 | 19 | 31 | 13 |
| 1994 | 41 | 32 | 45 | 13 | 23 | 0 | 39 | 36 | 28 | 74 | 44 | 45 |
| 1995 | 77 | 74 | 48 | 87 | 11 | 32 | 59 | 31 | 27 | 42 | 55 | 11 |
| 1996 | 56 | 22 | 30 | 29 | 28 | 30 | 35 | 31 | 46 | 13 | 25 | 38 |
| 1997 | 60 | 20 | 33 | 32 | 53 | 24 | 11 | 37 | 16 | 15 | 45 | 14 |
| 1998 | 43 | 46 | 35 | 32 | 17 | 45 | 25 | 9 | 33 | 19 | 40 | 19 |
| 1999 | 22 | 11 | 39 | 31 | 9 | 41 | 21 | 36 | 8 | 21 | 18 | 36 |
| 2000 | 32 | 22 | 27 | 72 | 11 | 39 | 24 | 35 | 45 | 46 | 14 | 38 |
| 2001 | 47 | 35 | 28 | 35 | 27 | 25 | 25 | 39 | 29 | 43 | 28 | 38 |
| 2002 | 28 | 38 | 38 | 37 | 61 | 25 | 25 | 16 | 10 | 8 | 38 | 30 |
| 2003 | 39 | 44 | 54 | 41 | 38 | 43 | 51 | 51 | 23 | 21 | 41 | 23 |
| 2004 | 23 | 58 | 29 | 17 | 17 | 25 | 32 | 29 | 29 | 57 | 31 | 39 |
| 2005 | 16 | 39 | 33 | 43 | 41 | 37 | 13 | 24 | 16 | 11 | 22 | 42 |
| 2006 | 40 | 55 | 28 | 46 | 24 | 40 | 65 | 52 | 25 | 31 | 49 | 18 |
| 2007 | 31 | 27 | 28 | 24 | 32 | 51 | 68 | 9 | 49 | 27 | 31 | 34 |
| 2008 | 34 | 35 | 46 | 17 | 46 | 53 | 68 | 20 | 23 | 40 | 55 | 56 |
| 2009 | 23 | 59 | 60 | 31 | 17 | 36 | 50 | 11 | 31 | 52 | 31 | 25 |
| 2010 | 30 | 7 | 47 | 42 | 64 | 43 | 35 | 25 | 47 | 30 | 51 | 20 |
| 2011 | 40 | 58 | 42 | 30 | 35 | 50 | 69 | 27 | 28 | 50 | 17 | 36 |
| 2012 | 30 | 19 | 70 | 18 | 16 | 44 | 30 | 18 | 24 | 35 | 28 | 23 |
| 2013 | 7 | 22 | 46 | 33 | 23 | 41 | 60 | 45 | 19 | 11 | 33 | 22 |
| 2014 | 29 | 32 | 45 | 82 | 32 | 32 | 52 | 13 | 44 | 33 | 19 | 19 |
| 2015 | 7 | 42 | 65 | 48 | 23 | 39 | 62 | 34 | 73 | 63 | 39 | 72 |
| 2016 | 49 | 53 | 55 | 32 | 42 | 40 | 33 | 14 | 100 | 41 | 23 | 46 |
| 2017 | 42 | 70 | 147 | 41 | 59 | 77 | 30 | 15 | 92 | 124 | 80 | 85 |
| 2018 | 148 | 125 | 166 | 122 | 179 | 189 | 164 | 108 | 135 | 141 | 66 | 69 |
| 2019 | 152 | 124 | 69 | 129 | 234 | 165 | 153 | 134 | 140 | 161 | 189 | 150 |
| 2020 | 113 | 161 | 232 | 114 | 112 | 135 | 256 | 199 | 229 | 175 | 85 | 160 |
| 2021 | 120 | 117 | 83 | 171 | 204 | 59 | 146 | 129 | 134 | 181 | 85 | 224 |
| 2022 | 267 | 204 | 160 | 181 | 267 | 253 | 254 | 144 | 124 | 213 | 143 | 198 |
| 2023 | 225 | 129 | 148 | 147 | 192 | 200 | 256 | 278 | 265 | 193 | 189 | 225 |
| 2024 | 95 | |||||||||||
| - = No Data Reported; -- = Not Applicable; NA = Not Available; W = Withheld to avoid disclosure of individual company data. |
| Release Date: 3/29/2024 |
| Next Release Date: 4/30/2024 |