|
Download Data (XLS File) |
|
||||||||
|
||||||||
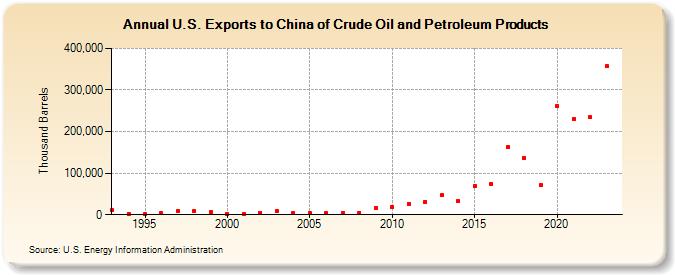
| U.S. Exports to China of Crude Oil and Petroleum Products (Thousand Barrels) | ||||||||
| Decade | Year-0 | Year-1 | Year-2 | Year-3 | Year-4 | Year-5 | Year-6 | Year-7 | Year-8 | Year-9 |
|---|---|---|---|---|---|---|---|---|---|---|
| 1990's | 10,730 | 2,579 | 634 | 2,955 | 9,500 | 9,502 | 7,077 | |||
| 2000's | 1,105 | 2,044 | 5,280 | 8,915 | 4,917 | 4,407 | 3,986 | 4,970 | 4,875 | 15,954 |
| 2010's | 18,894 | 26,756 | 31,175 | 46,995 | 32,570 | 69,864 | 74,160 | 163,193 | 136,632 | 71,503 |
| 2020's | 261,609 | 230,519 | 233,867 | 356,728 |
| - = No Data Reported; -- = Not Applicable; NA = Not Available; W = Withheld to avoid disclosure of individual company data. |
| Release Date: 3/29/2024 |
| Next Release Date: 8/30/2024 |