|
Download Data (XLS File) |
|
||||||||
|
||||||||
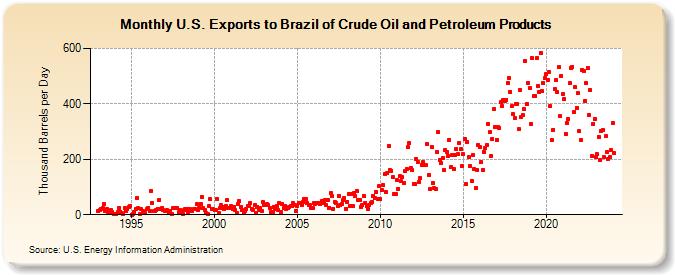
| U.S. Exports to Brazil of Crude Oil and Petroleum Products (Thousand Barrels per Day) | ||||||||
| Year | Jan | Feb | Mar | Apr | May | Jun | Jul | Aug | Sep | Oct | Nov | Dec |
|---|---|---|---|---|---|---|---|---|---|---|---|---|
| 1993 | 13 | 16 | 21 | 23 | 38 | 12 | 20 | 11 | 9 | 16 | 9 | 2 |
| 1994 | 2 | 4 | 9 | 25 | 11 | 5 | 3 | 24 | 12 | 22 | 27 | 33 |
| 1995 | 0 | 3 | 11 | 19 | 61 | 24 | 4 | 19 | 15 | 6 | 6 | 20 |
| 1996 | 26 | 12 | 87 | 44 | 13 | 15 | 16 | 21 | 54 | 21 | 26 | 17 |
| 1997 | 15 | 13 | 16 | 6 | 15 | 1 | 23 | 23 | 24 | 25 | 8 | 17 |
| 1998 | 10 | 3 | 16 | 20 | 20 | 10 | 21 | 18 | 14 | 21 | 20 | 37 |
| 1999 | 18 | 26 | 39 | 64 | 23 | 18 | 6 | 4 | 30 | 55 | 20 | 19 |
| 2000 | 17 | 17 | 56 | 5 | 25 | 34 | 28 | 21 | 31 | 52 | 25 | 24 |
| 2001 | 31 | 22 | 29 | 17 | 6 | 38 | 49 | 29 | 17 | 8 | 13 | 19 |
| 2002 | 31 | 31 | 42 | 22 | 18 | 34 | 5 | 29 | 17 | 24 | 14 | 45 |
| 2003 | 36 | 34 | 38 | 34 | 26 | 8 | 8 | 29 | 20 | 32 | 17 | 42 |
| 2004 | 11 | 38 | 24 | 32 | 20 | 25 | 27 | 30 | 31 | 41 | 34 | 15 |
| 2005 | 33 | 41 | 41 | 34 | 47 | 55 | 58 | 43 | 36 | 35 | 23 | 24 |
| 2006 | 41 | 40 | 44 | 41 | 40 | 41 | 48 | 41 | 52 | 35 | 53 | 26 |
| 2007 | 77 | 67 | 21 | 46 | 41 | 31 | 69 | 36 | 38 | 52 | 60 | 22 |
| 2008 | 47 | 74 | 30 | 74 | 32 | 78 | 67 | 85 | 52 | 54 | 29 | 34 |
| 2009 | 68 | 42 | 30 | 21 | 35 | 44 | 46 | 68 | 59 | 83 | 58 | 102 |
| 2010 | 56 | 88 | 106 | 146 | 83 | 149 | 247 | 161 | 159 | 136 | 75 | 73 |
| 2011 | 125 | 93 | 138 | 120 | 135 | 113 | 156 | 165 | 244 | 257 | 170 | 160 |
| 2012 | 112 | 110 | 201 | 189 | 119 | 131 | 181 | 189 | 179 | 178 | 255 | 145 |
| 2013 | 93 | 245 | 115 | 96 | 94 | 228 | 298 | 196 | 185 | 205 | 162 | 232 |
| 2014 | 227 | 212 | 270 | 172 | 215 | 164 | 216 | 237 | 219 | 259 | 237 | 175 |
| 2015 | 218 | 274 | 110 | 262 | 207 | 175 | 123 | 216 | 164 | 97 | 163 | 252 |
| 2016 | 243 | 189 | 162 | 228 | 241 | 251 | 329 | 298 | 211 | 273 | 381 | 315 |
| 2017 | 270 | 317 | 312 | 405 | 393 | 414 | 410 | 415 | 476 | 492 | 444 | 391 |
| 2018 | 363 | 349 | 399 | 400 | 308 | 450 | 354 | 358 | 380 | 554 | 401 | 476 |
| 2019 | 457 | 328 | 564 | 428 | 428 | 565 | 466 | 443 | 585 | 446 | 476 | 493 |
| 2020 | 506 | 487 | 516 | 391 | 269 | 307 | 452 | 486 | 443 | 533 | 355 | 500 |
| 2021 | 434 | 417 | 292 | 331 | 345 | 475 | 531 | 534 | 372 | 460 | 386 | 438 |
| 2022 | 301 | 268 | 522 | 518 | 412 | 475 | 531 | 361 | 449 | 213 | 328 | 347 |
| 2023 | 209 | 218 | 282 | 198 | 302 | 305 | 208 | 283 | 226 | 202 | 208 | 234 |
| 2024 | 332 | |||||||||||
| - = No Data Reported; -- = Not Applicable; NA = Not Available; W = Withheld to avoid disclosure of individual company data. |
| Release Date: 3/29/2024 |
| Next Release Date: 4/30/2024 |