|
Download Data (XLS File) |
|
||||||||
|
||||||||
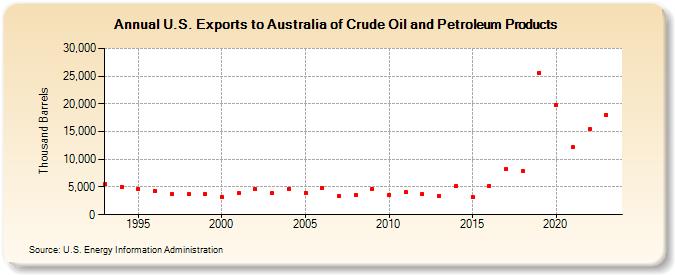
| U.S. Exports to Australia of Crude Oil and Petroleum Products (Thousand Barrels) | ||||||||
| Decade | Year-0 | Year-1 | Year-2 | Year-3 | Year-4 | Year-5 | Year-6 | Year-7 | Year-8 | Year-9 |
|---|---|---|---|---|---|---|---|---|---|---|
| 1990's | 5,525 | 5,086 | 4,650 | 4,324 | 3,714 | 3,684 | 3,710 | |||
| 2000's | 3,249 | 3,870 | 4,554 | 3,892 | 4,727 | 3,971 | 4,883 | 3,343 | 3,618 | 4,689 |
| 2010's | 3,561 | 4,022 | 3,748 | 3,391 | 5,163 | 3,150 | 5,251 | 8,287 | 7,940 | 25,621 |
| 2020's | 19,700 | 12,160 | 15,409 | 18,056 |
| - = No Data Reported; -- = Not Applicable; NA = Not Available; W = Withheld to avoid disclosure of individual company data. |
| Release Date: 3/29/2024 |
| Next Release Date: 8/30/2024 |