|
Download Data (XLS File) |
|
||||||||
|
||||||||
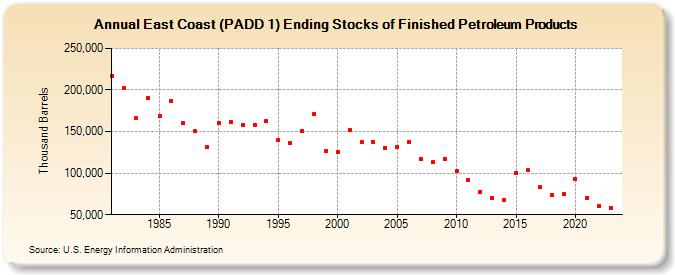
| East Coast (PADD 1) Ending Stocks of Finished Petroleum Products (Thousand Barrels) | ||||||||
| Decade | Year-0 | Year-1 | Year-2 | Year-3 | Year-4 | Year-5 | Year-6 | Year-7 | Year-8 | Year-9 |
|---|---|---|---|---|---|---|---|---|---|---|
| 1980's | 216,223 | 202,017 | 165,707 | 190,866 | 169,119 | 187,163 | 159,907 | 150,138 | 131,293 | |
| 1990's | 160,002 | 161,310 | 157,549 | 157,610 | 162,867 | 139,704 | 135,983 | 151,053 | 170,636 | 126,587 |
| 2000's | 124,848 | 151,658 | 137,124 | 137,534 | 130,385 | 131,883 | 137,827 | 117,578 | 112,929 | 116,761 |
| 2010's | 102,106 | 91,770 | 77,347 | 70,532 | 67,918 | 100,657 | 103,254 | 83,164 | 73,157 | 74,993 |
| 2020's | 93,543 | 70,560 | 60,405 | 58,037 |
| - = No Data Reported; -- = Not Applicable; NA = Not Available; W = Withheld to avoid disclosure of individual company data. |
| Release Date: 3/29/2024 |
| Next Release Date: 8/30/2024 |