|
Download Data (XLS File) |
|
||||||||
|
||||||||
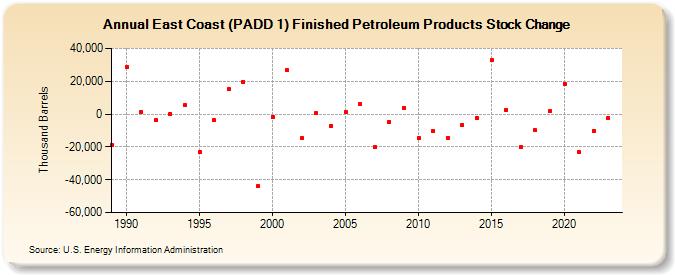
| East Coast (PADD 1) Finished Petroleum Products Stock Change (Thousand Barrels) | ||||||||
| Decade | Year-0 | Year-1 | Year-2 | Year-3 | Year-4 | Year-5 | Year-6 | Year-7 | Year-8 | Year-9 |
|---|---|---|---|---|---|---|---|---|---|---|
| 1980's | -18,845 | |||||||||
| 1990's | 28,709 | 1,308 | -3,761 | 61 | 5,257 | -23,163 | -3,721 | 15,070 | 19,583 | -44,049 |
| 2000's | -1,739 | 26,810 | -14,534 | 410 | -7,149 | 1,498 | 5,944 | -20,249 | -4,649 | 3,832 |
| 2010's | -14,655 | -10,336 | -14,423 | -6,815 | -2,614 | 32,739 | 2,597 | -20,090 | -10,007 | 1,836 |
| 2020's | 18,550 | -22,983 | -10,155 | -2,392 |
| - = No Data Reported; -- = Not Applicable; NA = Not Available; W = Withheld to avoid disclosure of individual company data. |
| Release Date: 3/29/2024 |
| Next Release Date: 8/30/2024 |