|
Download Data (XLS File) |
|
||||||||
|
||||||||
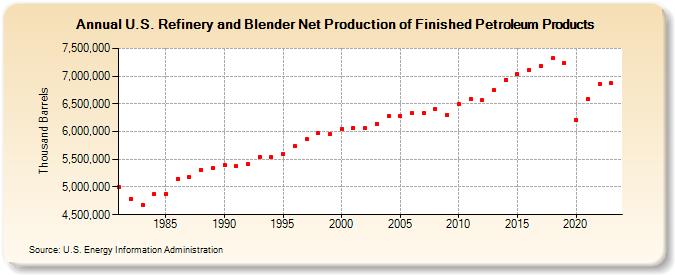
| U.S. Refinery and Blender Net Production of Finished Petroleum Products (Thousand Barrels) | ||||||||
| Decade | Year-0 | Year-1 | Year-2 | Year-3 | Year-4 | Year-5 | Year-6 | Year-7 | Year-8 | Year-9 |
|---|---|---|---|---|---|---|---|---|---|---|
| 1980's | 4,991,572 | 4,789,229 | 4,675,740 | 4,873,827 | 4,875,970 | 5,148,364 | 5,174,954 | 5,315,535 | 5,336,477 | |
| 1990's | 5,392,283 | 5,372,971 | 5,413,383 | 5,546,344 | 5,540,427 | 5,599,163 | 5,732,210 | 5,864,702 | 5,970,090 | 5,951,567 |
| 2000's | 6,052,920 | 6,065,678 | 6,059,720 | 6,142,712 | 6,283,778 | 6,287,986 | 6,331,952 | 6,329,025 | 6,410,862 | 6,299,599 |
| 2010's | 6,494,613 | 6,589,598 | 6,563,994 | 6,746,361 | 6,935,245 | 7,033,985 | 7,117,775 | 7,179,380 | 7,321,367 | 7,239,258 |
| 2020's | 6,201,066 | 6,586,455 | 6,856,645 | 6,874,878 |
| - = No Data Reported; -- = Not Applicable; NA = Not Available; W = Withheld to avoid disclosure of individual company data. |
| Release Date: 3/29/2024 |
| Next Release Date: 8/30/2024 |