|
Download Data (XLS File) |
|
||||||||
|
||||||||
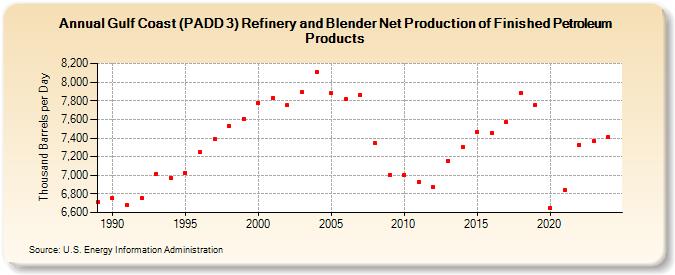
| Gulf Coast (PADD 3) Refinery and Blender Net Production of Finished Petroleum Products (Thousand Barrels per Day) | ||||||||
| Decade | Year-0 | Year-1 | Year-2 | Year-3 | Year-4 | Year-5 | Year-6 | Year-7 | Year-8 | Year-9 |
|---|---|---|---|---|---|---|---|---|---|---|
| 1980's | 6,710 | |||||||||
| 1990's | 6,754 | 6,681 | 6,754 | 7,014 | 6,973 | 7,028 | 7,246 | 7,394 | 7,533 | 7,607 |
| 2000's | 7,774 | 7,833 | 7,750 | 7,892 | 8,110 | 7,880 | 7,815 | 7,866 | 7,343 | 7,004 |
| 2010's | 7,007 | 6,931 | 6,874 | 7,158 | 7,306 | 7,469 | 7,456 | 7,570 | 7,881 | 7,756 |
| 2020's | 6,654 | 6,838 | 7,330 | 7,367 |
| - = No Data Reported; -- = Not Applicable; NA = Not Available; W = Withheld to avoid disclosure of individual company data. |
| Release Date: 8/30/2024 |
| Next Release Date: 8/29/2025 |