|
Download Data (XLS File) |
|
||||||||
|
||||||||
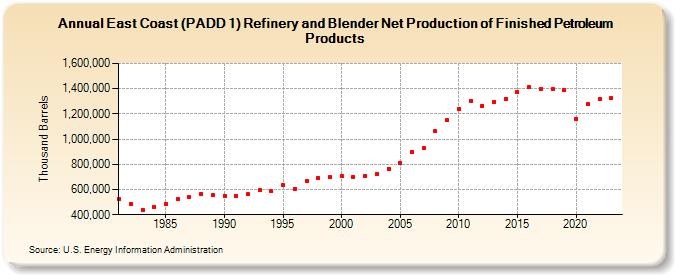
| East Coast (PADD 1) Refinery and Blender Net Production of Finished Petroleum Products (Thousand Barrels) | ||||||||
| Decade | Year-0 | Year-1 | Year-2 | Year-3 | Year-4 | Year-5 | Year-6 | Year-7 | Year-8 | Year-9 |
|---|---|---|---|---|---|---|---|---|---|---|
| 1980's | 524,830 | 487,305 | 438,220 | 464,106 | 484,637 | 524,409 | 537,645 | 563,223 | 555,592 | |
| 1990's | 549,110 | 550,561 | 563,639 | 593,093 | 585,796 | 634,740 | 606,441 | 671,139 | 692,478 | 700,368 |
| 2000's | 705,056 | 701,492 | 704,223 | 724,087 | 765,887 | 809,738 | 897,618 | 926,529 | 1,061,704 | 1,148,435 |
| 2010's | 1,239,243 | 1,301,603 | 1,266,099 | 1,296,574 | 1,321,035 | 1,372,578 | 1,413,949 | 1,401,473 | 1,399,067 | 1,389,276 |
| 2020's | 1,159,998 | 1,277,211 | 1,316,454 | 1,323,916 |
| - = No Data Reported; -- = Not Applicable; NA = Not Available; W = Withheld to avoid disclosure of individual company data. |
| Release Date: 3/29/2024 |
| Next Release Date: 8/30/2024 |