|
Download Data (XLS File) |
|
||||||||
|
||||||||
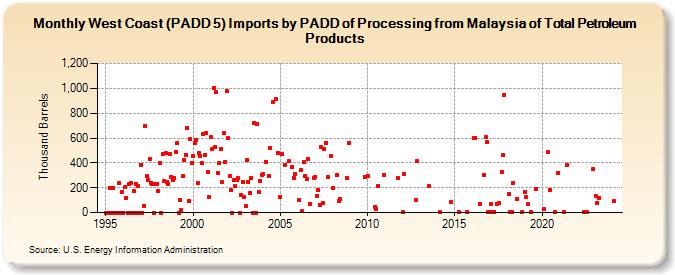
| West Coast (PADD 5) Imports by PADD of Processing from Malaysia of Total Petroleum Products (Thousand Barrels) | ||||||||
| Year | Jan | Feb | Mar | Apr | May | Jun | Jul | Aug | Sep | Oct | Nov | Dec |
|---|---|---|---|---|---|---|---|---|---|---|---|---|
| 1995 | 0 | 0 | 0 | 201 | 0 | 199 | 0 | 0 | 0 | 235 | 0 | 164 |
| 1996 | 0 | 203 | 120 | 0 | 230 | 241 | 0 | 170 | 0 | 230 | 213 | 0 |
| 1997 | 386 | 0 | 56 | 699 | 291 | 266 | 431 | 241 | 233 | 0 | 230 | 229 |
| 1998 | 173 | 396 | 0 | 470 | 253 | 477 | 249 | 230 | 474 | 290 | 263 | 282 |
| 1999 | 489 | 557 | 0 | 105 | 19 | 296 | 425 | 466 | 678 | 96 | 593 | 399 |
| 2000 | 458 | 561 | 587 | 238 | 479 | 459 | 400 | 636 | 463 | 641 | 323 | 122 |
| 2001 | 609 | 513 | 1,006 | 529 | 968 | 319 | 397 | 515 | 242 | 641 | 407 | 982 |
| 2002 | 602 | 295 | 178 | 0 | 259 | 211 | 266 | 276 | 0 | 141 | 245 | 123 |
| 2003 | 54 | 425 | 249 | 158 | 279 | 0 | 721 | 0 | 716 | 167 | 256 | 300 |
| 2004 | 311 | 409 | 295 | 523 | 891 | 912 | 477 | |||||
| 2005 | 126 | 475 | 386 | 413 | 363 | 279 | 309 | |||||
| 2006 | 100 | 342 | 9 | 403 | 295 | 272 | 432 | 70 | 282 | |||
| 2007 | 289 | 131 | 179 | 60 | 526 | 76 | 515 | 559 | 284 | 455 | ||
| 2008 | 199 | 301 | 95 | 106 | 277 | 562 | ||||||
| 2009 | 289 | |||||||||||
| 2010 | 293 | 45 | 30 | 212 | 301 | |||||||
| 2011 | 279 | |||||||||||
| 2012 | 1 | 310 | 101 | 416 | ||||||||
| 2013 | 212 | |||||||||||
| 2014 | 1 | 83 | ||||||||||
| 2015 | 1 | 1 | ||||||||||
| 2016 | 601 | 601 | 72 | 304 | 608 | 564 | 1 | |||||
| 2017 | 1 | 70 | 1 | 1 | 65 | 74 | 327 | 463 | 947 | |||
| 2018 | 151 | 1 | 1 | 241 | 112 | 1 | ||||||
| 2019 | 163 | 126 | 66 | 1 | 191 | |||||||
| 2020 | 32 | 486 | 184 | 1 | 320 | |||||||
| 2021 | 1 | 379 | ||||||||||
| 2022 | 1 | 1 | 350 | |||||||||
| 2023 | 131 | 77 | 119 | |||||||||
| - = No Data Reported; -- = Not Applicable; NA = Not Available; W = Withheld to avoid disclosure of individual company data. |
| Release Date: 3/29/2024 |
| Next Release Date: 4/30/2024 |