|
Download Data (XLS File) |
|
||||||||
|
||||||||
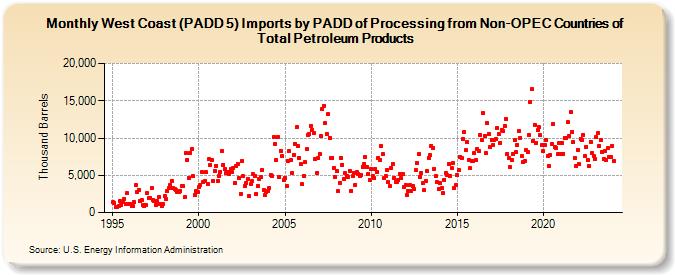
| West Coast (PADD 5) Imports by PADD of Processing from Non-OPEC Countries of Total Petroleum Products (Thousand Barrels) | ||||||||
| Year | Jan | Feb | Mar | Apr | May | Jun | Jul | Aug | Sep | Oct | Nov | Dec |
|---|---|---|---|---|---|---|---|---|---|---|---|---|
| 1995 | 1,350 | 1,270 | 775 | 781 | 830 | 1,549 | 1,006 | 1,435 | 1,847 | 1,204 | 2,567 | 1,149 |
| 1996 | 1,150 | 937 | 839 | 1,370 | 3,659 | 2,769 | 3,014 | 1,484 | 1,669 | 1,038 | 896 | 977 |
| 1997 | 2,616 | 1,905 | 1,973 | 3,303 | 1,626 | 1,533 | 1,062 | 1,502 | 2,054 | 1,156 | 876 | 1,110 |
| 1998 | 2,188 | 1,882 | 2,834 | 3,260 | 3,760 | 4,295 | 3,276 | 3,175 | 3,006 | 2,772 | 2,797 | 2,916 |
| 1999 | 3,549 | 3,521 | 2,033 | 8,029 | 7,108 | 4,700 | 8,043 | 8,510 | 4,860 | 2,329 | 2,891 | 2,786 |
| 2000 | 3,493 | 3,751 | 5,413 | 4,117 | 4,177 | 5,386 | 3,794 | 7,125 | 6,434 | 7,014 | 4,291 | 5,616 |
| 2001 | 6,308 | 4,254 | 4,941 | 5,466 | 8,236 | 6,437 | 5,877 | 5,288 | 5,419 | 5,145 | 5,813 | 5,427 |
| 2002 | 6,031 | 3,993 | 6,214 | 6,543 | 4,616 | 2,505 | 6,933 | 4,860 | 3,507 | 4,025 | 4,458 | 2,241 |
| 2003 | 3,765 | 4,200 | 5,133 | 4,866 | 2,500 | 3,604 | 4,545 | 4,727 | 5,709 | 3,006 | 2,378 | 2,822 |
| 2004 | 2,931 | 3,298 | 5,075 | 4,960 | 10,157 | 9,204 | 7,111 | 10,160 | 4,810 | 8,292 | 7,571 | 4,333 |
| 2005 | 4,682 | 3,593 | 6,977 | 8,202 | 7,049 | 5,311 | 7,741 | 9,246 | 11,429 | 8,901 | 7,361 | 6,499 |
| 2006 | 3,768 | 4,939 | 6,721 | 8,479 | 10,391 | 10,550 | 11,651 | 11,066 | 10,700 | 7,160 | 5,301 | 7,273 |
| 2007 | 7,862 | 10,254 | 13,872 | 14,346 | 11,954 | 10,587 | 13,192 | 10,052 | 7,377 | 7,366 | 6,027 | 4,772 |
| 2008 | 5,524 | 2,829 | 4,012 | 7,363 | 6,414 | 4,545 | 5,253 | 4,873 | 4,820 | 5,631 | 2,933 | 4,848 |
| 2009 | 5,330 | 3,751 | 5,434 | 5,201 | 4,953 | 5,102 | 6,161 | 6,551 | 7,458 | 6,150 | 5,162 | 4,422 |
| 2010 | 5,849 | 4,945 | 4,616 | 5,848 | 5,395 | 7,385 | 7,060 | 8,878 | 7,832 | 4,629 | 4,839 | 5,750 |
| 2011 | 4,052 | 3,522 | 6,012 | 6,558 | 4,674 | 4,120 | 4,143 | 4,317 | 5,196 | 4,611 | 5,130 | 3,463 |
| 2012 | 3,696 | 2,415 | 2,843 | 3,659 | 2,914 | 3,591 | 3,155 | 5,696 | 6,703 | 7,790 | 4,775 | 5,280 |
| 2013 | 3,924 | 2,997 | 4,265 | 5,536 | 7,358 | 7,701 | 8,971 | 8,703 | 5,888 | 4,900 | 4,042 | 3,120 |
| 2014 | 3,931 | 3,244 | 2,598 | 4,416 | 5,284 | 4,984 | 6,488 | 4,916 | 5,943 | 6,622 | 3,341 | 3,674 |
| 2015 | 5,035 | 5,655 | 7,496 | 7,372 | 9,911 | 10,837 | 8,352 | 9,428 | 7,058 | 5,915 | 6,962 | 6,981 |
| 2016 | 7,967 | 7,034 | 8,480 | 8,291 | 10,383 | 9,740 | 13,335 | 10,318 | 7,931 | 11,996 | 10,594 | 8,833 |
| 2017 | 9,780 | 9,080 | 9,780 | 9,859 | 11,403 | 10,505 | 9,386 | 11,111 | 10,907 | 11,606 | 12,574 | 7,865 |
| 2018 | 7,311 | 6,057 | 7,062 | 7,879 | 9,677 | 8,075 | 9,122 | 10,954 | 10,062 | 7,522 | 6,738 | 6,912 |
| 2019 | 8,330 | 8,121 | 10,404 | 14,895 | 16,596 | 9,658 | 11,804 | 9,334 | 11,010 | 11,419 | 10,377 | 9,063 |
| 2020 | 8,215 | 9,073 | 9,773 | 7,534 | 6,189 | 7,764 | 9,213 | 11,867 | 8,812 | 8,629 | 7,815 | 9,299 |
| 2021 | 7,805 | 9,343 | 7,892 | 10,066 | 9,947 | 12,121 | 10,328 | 13,434 | 10,811 | 9,442 | 7,356 | 6,278 |
| 2022 | 8,443 | 6,469 | 9,852 | 9,780 | 10,452 | 7,565 | 8,846 | 7,051 | 6,281 | 9,518 | 7,994 | 7,644 |
| 2023 | 7,218 | 10,101 | 10,669 | 8,943 | 9,770 | 8,158 | 7,206 | 8,267 | 7,013 | 8,624 | 7,473 | 7,424 |
| 2024 | 8,989 | |||||||||||
| - = No Data Reported; -- = Not Applicable; NA = Not Available; W = Withheld to avoid disclosure of individual company data. |
| Release Date: 3/29/2024 |
| Next Release Date: 4/30/2024 |