|
Download Data (XLS File) |
|
||||||||
|
||||||||
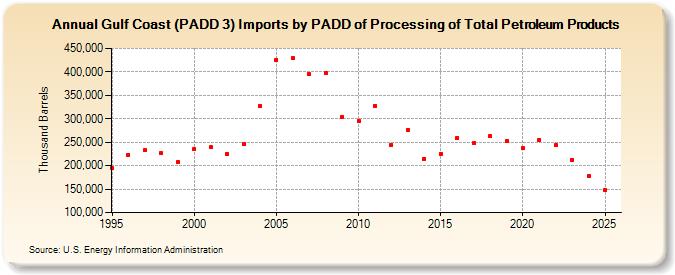
| Gulf Coast (PADD 3) Imports by PADD of Processing of Total Petroleum Products (Thousand Barrels) | ||||||||
| Decade | Year-0 | Year-1 | Year-2 | Year-3 | Year-4 | Year-5 | Year-6 | Year-7 | Year-8 | Year-9 |
|---|---|---|---|---|---|---|---|---|---|---|
| 1990's | 194,700 | 223,426 | 233,183 | 225,971 | 207,394 | |||||
| 2000's | 234,706 | 239,720 | 225,148 | 245,911 | 326,706 | 425,751 | 428,527 | 394,858 | 397,438 | 303,874 |
| 2010's | 294,517 | 327,628 | 244,440 | 276,916 | 215,025 | 225,773 | 259,449 | 248,010 | 263,171 | 252,145 |
| 2020's | 236,695 | 254,829 | 244,333 | 212,781 |
| - = No Data Reported; -- = Not Applicable; NA = Not Available; W = Withheld to avoid disclosure of individual company data. |
| Release Date: 3/29/2024 |
| Next Release Date: 8/30/2024 |