|
Download Data (XLS File) |
|
||||||||
|
||||||||
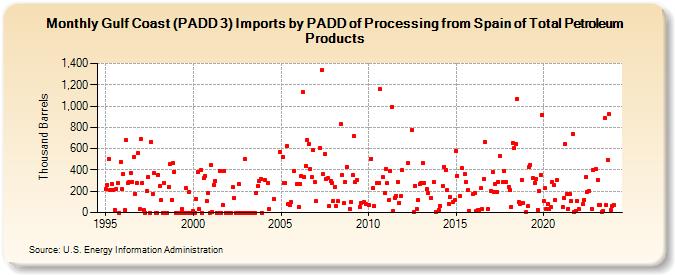
| Gulf Coast (PADD 3) Imports by PADD of Processing from Spain of Total Petroleum Products (Thousand Barrels) | ||||||||
| Year | Jan | Feb | Mar | Apr | May | Jun | Jul | Aug | Sep | Oct | Nov | Dec |
|---|---|---|---|---|---|---|---|---|---|---|---|---|
| 1995 | 219 | 258 | 499 | 211 | 271 | 209 | 27 | 222 | 279 | 0 | 475 | 218 |
| 1996 | 363 | 22 | 679 | 282 | 285 | 374 | 285 | 523 | 177 | 280 | 561 | 31 |
| 1997 | 693 | 279 | 22 | 0 | 200 | 335 | 0 | 665 | 177 | 370 | 0 | 0 |
| 1998 | 354 | 249 | 115 | 0 | 280 | 0 | 0 | 244 | 459 | 122 | 470 | 385 |
| 1999 | 0 | 0 | 0 | 0 | 32 | 0 | 0 | 231 | 0 | 193 | 0 | 0 |
| 2000 | 13 | 0 | 131 | 379 | 30 | 398 | 0 | 322 | 347 | 109 | 182 | 0 |
| 2001 | 445 | 5 | 263 | 297 | 0 | 0 | 393 | 0 | 74 | 389 | 0 | 0 |
| 2002 | 0 | 0 | 0 | 236 | 140 | 0 | 0 | 269 | 0 | 0 | 0 | 499 |
| 2003 | 0 | 0 | 0 | 0 | 0 | 0 | 0 | 186 | 249 | 301 | 317 | 0 |
| 2004 | 309 | 282 | 32 | 132 | 569 | |||||||
| 2005 | 525 | 279 | 278 | 625 | 80 | 70 | 101 | 386 | 271 | |||
| 2006 | 53 | 268 | 343 | 1,129 | 334 | 439 | 681 | 643 | 407 | 333 | 585 | 289 |
| 2007 | 105 | 608 | 1,339 | 359 | 551 | 319 | 320 | 59 | 297 | 277 | ||
| 2008 | 110 | 241 | 61 | 106 | 827 | 356 | 88 | 288 | 431 | 35 | ||
| 2009 | 103 | 352 | 717 | 290 | 306 | 55 | 89 | 98 | 78 | |||
| 2010 | 75 | 504 | 230 | 57 | 274 | 276 | 1,157 | 331 | 183 | |||
| 2011 | 413 | 275 | 117 | 388 | 992 | 16 | 140 | 160 | 289 | 93 | 156 | 399 |
| 2012 | 462 | 774 | 2 | 252 | 36 | 118 | 265 | |||||
| 2013 | 274 | 467 | 280 | 220 | 180 | 140 | 286 | 9 | ||||
| 2014 | 25 | 64 | 246 | 432 | 399 | 214 | 82 | 148 | 98 | 116 | ||
| 2015 | 582 | 347 | 153 | 416 | 359 | 287 | 214 | 19 | ||||
| 2016 | 178 | 184 | 14 | 22 | 27 | 228 | 30 | 319 | 667 | 31 | ||
| 2017 | 206 | 380 | 195 | 269 | 195 | 289 | 530 | 284 | 388 | 288 | ||
| 2018 | 241 | 211 | 56 | 656 | 608 | 647 | 1,069 | 99 | 83 | 309 | 94 | |
| 2019 | 1 | 57 | 425 | 450 | 324 | 275 | 315 | 27 | 200 | 357 | 919 | |
| 2020 | 106 | 231 | 38 | 83 | 29 | 56 | 291 | 263 | 118 | 305 | ||
| 2021 | 52 | 136 | 644 | 172 | 37 | 176 | 109 | 742 | 1 | 19 | 107 | |
| 2022 | 33 | 76 | 122 | 331 | 197 | 202 | 37 | 403 | ||||
| 2023 | 409 | 306 | 74 | 75 | 9 | 13 | 891 | 71 | 494 | 921 | 26 | 59 |
| 2024 | 71 | |||||||||||
| - = No Data Reported; -- = Not Applicable; NA = Not Available; W = Withheld to avoid disclosure of individual company data. |
| Release Date: 3/29/2024 |
| Next Release Date: 4/30/2024 |