|
Download Data (XLS File) |
|
||||||||
|
||||||||
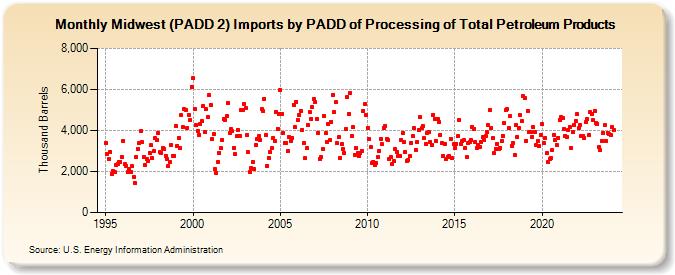
| Midwest (PADD 2) Imports by PADD of Processing of Total Petroleum Products (Thousand Barrels) | ||||||||
| Year | Jan | Feb | Mar | Apr | May | Jun | Jul | Aug | Sep | Oct | Nov | Dec |
|---|---|---|---|---|---|---|---|---|---|---|---|---|
| 1995 | 3,382 | 2,875 | 2,603 | 2,969 | 1,886 | 2,026 | 1,976 | 2,307 | 2,374 | 2,484 | 2,466 | 2,707 |
| 1996 | 3,494 | 2,353 | 2,288 | 1,974 | 2,109 | 1,992 | 2,247 | 1,750 | 1,436 | 2,702 | 3,117 | 3,366 |
| 1997 | 3,984 | 3,426 | 2,702 | 2,295 | 2,625 | 2,504 | 2,917 | 3,269 | 2,656 | 2,996 | 3,611 | 3,536 |
| 1998 | 3,884 | 2,930 | 2,917 | 3,128 | 3,108 | 2,775 | 2,624 | 2,267 | 2,460 | 3,295 | 2,772 | 2,775 |
| 1999 | 4,242 | 3,263 | 3,640 | 3,167 | 4,739 | 4,163 | 5,031 | 5,013 | 4,141 | 4,761 | 4,500 | 6,132 |
| 2000 | 6,551 | 5,061 | 4,257 | 3,991 | 3,788 | 4,298 | 4,448 | 5,183 | 3,911 | 5,030 | 4,646 | 5,723 |
| 2001 | 5,251 | 3,589 | 3,840 | 2,111 | 1,946 | 2,484 | 2,915 | 3,128 | 3,540 | 4,547 | 4,530 | 4,682 |
| 2002 | 5,340 | 3,881 | 4,048 | 3,970 | 3,146 | 2,839 | 3,708 | 4,011 | 3,736 | 4,982 | 5,016 | 5,312 |
| 2003 | 5,098 | 3,786 | 2,932 | 1,988 | 2,176 | 2,482 | 2,142 | 3,291 | 3,579 | 3,715 | 3,531 | 5,038 |
| 2004 | 4,926 | 5,548 | 3,775 | 2,276 | 2,665 | 2,930 | 3,127 | 3,616 | 3,495 | 4,919 | 4,096 | 4,819 |
| 2005 | 5,983 | 4,810 | 3,900 | 3,379 | 3,395 | 2,999 | 3,675 | 3,476 | 3,649 | 5,255 | 4,154 | 5,410 |
| 2006 | 4,508 | 4,767 | 4,951 | 4,043 | 3,373 | 2,645 | 3,137 | 4,261 | 4,924 | 4,570 | 5,127 | 5,554 |
| 2007 | 5,396 | 4,575 | 3,901 | 2,599 | 2,685 | 3,095 | 4,706 | 3,864 | 3,456 | 4,338 | 3,520 | 4,437 |
| 2008 | 5,747 | 4,910 | 5,369 | 3,387 | 3,659 | 2,680 | 3,325 | 3,119 | 2,893 | 4,095 | 5,619 | 4,816 |
| 2009 | 5,824 | 3,724 | 4,148 | 2,828 | 3,156 | 2,894 | 2,732 | 2,885 | 3,015 | 4,961 | 5,291 | 4,733 |
| 2010 | 4,143 | 3,568 | 3,175 | 2,414 | 2,486 | 2,320 | 2,407 | 2,710 | 3,012 | 3,586 | 3,328 | 4,133 |
| 2011 | 4,218 | 3,591 | 3,516 | 2,589 | 2,704 | 2,344 | 2,494 | 3,096 | 2,944 | 2,742 | 2,760 | 3,551 |
| 2012 | 3,889 | 3,419 | 2,960 | 2,502 | 2,582 | 2,739 | 3,404 | 3,723 | 4,102 | 3,061 | 3,440 | 4,016 |
| 2013 | 4,648 | 4,132 | 4,210 | 3,611 | 3,359 | 3,898 | 3,916 | 3,441 | 3,291 | 4,772 | 4,553 | 3,484 |
| 2014 | 4,578 | 4,410 | 3,792 | 3,401 | 2,768 | 3,354 | 2,600 | 2,726 | 2,750 | 3,585 | 2,638 | 3,326 |
| 2015 | 3,159 | 3,363 | 3,723 | 4,521 | 3,332 | 3,465 | 3,520 | 3,140 | 2,691 | 3,400 | 3,436 | 3,527 |
| 2016 | 4,165 | 4,091 | 3,420 | 3,130 | 3,303 | 3,209 | 3,461 | 3,680 | 3,548 | 3,720 | 3,910 | 4,263 |
| 2017 | 4,989 | 4,122 | 3,634 | 2,888 | 3,115 | 3,345 | 3,087 | 3,163 | 3,503 | 3,752 | 4,388 | 4,974 |
| 2018 | 5,028 | 4,105 | 4,688 | 3,261 | 3,375 | 2,823 | 4,276 | 3,705 | 4,133 | 4,752 | 4,442 | 5,661 |
| 2019 | 5,565 | 3,494 | 4,959 | 3,916 | 3,944 | 3,700 | 4,151 | 3,948 | 3,297 | 3,493 | 3,236 | 3,787 |
| 2020 | 4,308 | 3,368 | 3,648 | 2,883 | 2,467 | 2,591 | 2,664 | 3,040 | 3,798 | 3,542 | 3,298 | 3,647 |
| 2021 | 4,532 | 4,634 | 4,598 | 4,082 | 3,736 | 3,683 | 4,032 | 4,176 | 3,159 | 3,920 | 4,283 | 4,467 |
| 2022 | 4,785 | 4,103 | 4,275 | 3,707 | 3,744 | 3,627 | 4,406 | 4,554 | 3,768 | 4,894 | 4,825 | 4,497 |
| 2023 | 4,977 | 4,364 | 4,341 | 3,195 | 3,064 | 3,495 | 3,897 | 4,252 | 3,483 | 3,931 | 3,819 | 3,800 |
| 2024 | 4,148 | 4,027 | 4,380 | 3,184 | 3,958 | 3,642 | ||||||
| - = No Data Reported; -- = Not Applicable; NA = Not Available; W = Withheld to avoid disclosure of individual company data. |
| Release Date: 8/30/2024 |
| Next Release Date: 9/30/2024 |