|
Download Data (XLS File) |
|
||||||||
|
||||||||
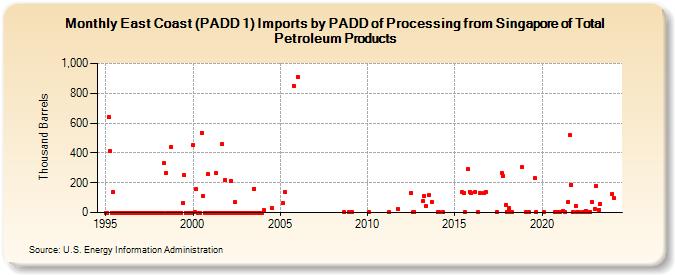
| East Coast (PADD 1) Imports by PADD of Processing from Singapore of Total Petroleum Products (Thousand Barrels) | ||||||||
| Year | Jan | Feb | Mar | Apr | May | Jun | Jul | Aug | Sep | Oct | Nov | Dec |
|---|---|---|---|---|---|---|---|---|---|---|---|---|
| 1995 | 0 | 0 | 642 | 412 | 0 | 138 | 0 | 0 | 0 | 0 | 0 | 0 |
| 1996 | 0 | 0 | 0 | 0 | 0 | 0 | 0 | 0 | 0 | 0 | 0 | 0 |
| 1997 | 0 | 0 | 0 | 0 | 0 | 0 | 0 | 0 | 0 | 0 | 0 | 0 |
| 1998 | 0 | 0 | 0 | 0 | 331 | 265 | 0 | 0 | 0 | 442 | 0 | 0 |
| 1999 | 0 | 0 | 0 | 0 | 0 | 67 | 249 | 0 | 0 | 0 | 0 | 0 |
| 2000 | 453 | 2 | 155 | 0 | 0 | 0 | 536 | 110 | 0 | 0 | 256 | 0 |
| 2001 | 0 | 0 | 0 | 0 | 266 | 0 | 0 | 0 | 460 | 0 | 221 | 0 |
| 2002 | 0 | 0 | 212 | 0 | 0 | 69 | 0 | 0 | 0 | 0 | 0 | 0 |
| 2003 | 0 | 0 | 0 | 0 | 0 | 0 | 161 | 0 | 0 | 0 | 0 | 0 |
| 2004 | 14 | 30 | ||||||||||
| 2005 | 61 | 137 | 851 | |||||||||
| 2006 | 910 | |||||||||||
| 2008 | 1 | 1 | ||||||||||
| 2009 | 1 | |||||||||||
| 2010 | 1 | |||||||||||
| 2011 | 1 | 23 | ||||||||||
| 2012 | 133 | 2 | 5 | |||||||||
| 2013 | 79 | 112 | 41 | 116 | 74 | |||||||
| 2014 | 1 | 1 | 1 | |||||||||
| 2015 | 135 | 134 | 1 | 290 | 140 | 134 | ||||||
| 2016 | 140 | 1 | 133 | 130 | 141 | |||||||
| 2017 | 1 | 267 | 246 | 53 | ||||||||
| 2018 | 1 | 31 | 5 | 1 | 303 | |||||||
| 2019 | 1 | 1 | 231 | 1 | ||||||||
| 2020 | 1 | 1 | 1 | 1 | ||||||||
| 2021 | 1 | 12 | 1 | 74 | 518 | 187 | 1 | 47 | ||||
| 2022 | 1 | 1 | 1 | 1 | 13 | 2 | 4 | 6 | 73 | |||
| 2023 | 27 | 177 | 20 | 57 | ||||||||
| 2024 | 125 | |||||||||||
| - = No Data Reported; -- = Not Applicable; NA = Not Available; W = Withheld to avoid disclosure of individual company data. |
| Release Date: 3/29/2024 |
| Next Release Date: 4/30/2024 |