|
Download Data (XLS File) |
|
||||||||
|
||||||||
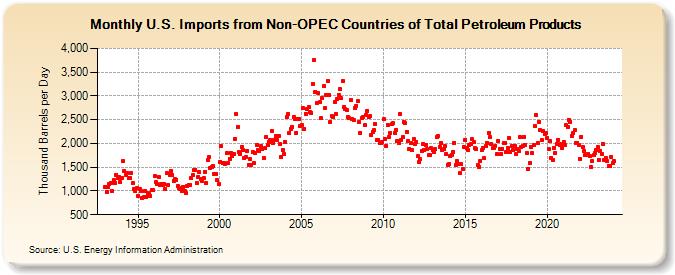
| U.S. Imports from Non-OPEC Countries of Total Petroleum Products (Thousand Barrels per Day) | ||||||||
| Year | Jan | Feb | Mar | Apr | May | Jun | Jul | Aug | Sep | Oct | Nov | Dec |
|---|---|---|---|---|---|---|---|---|---|---|---|---|
| 1993 | 1,088 | 981 | 1,085 | 1,154 | 1,175 | 997 | 1,228 | 1,169 | 1,344 | 1,276 | 1,297 | 1,188 |
| 1994 | 1,280 | 1,628 | 1,418 | 1,334 | 1,378 | 1,267 | 1,277 | 1,380 | 1,164 | 1,040 | 991 | 1,059 |
| 1995 | 900 | 1,038 | 990 | 847 | 864 | 1,002 | 871 | 956 | 941 | 900 | 1,018 | 1,014 |
| 1996 | 1,312 | 1,181 | 1,143 | 1,296 | 1,133 | 1,137 | 1,120 | 1,144 | 1,047 | 1,370 | 1,132 | 1,345 |
| 1997 | 1,430 | 1,338 | 1,210 | 1,257 | 1,238 | 1,106 | 1,064 | 1,047 | 1,006 | 1,086 | 996 | 951 |
| 1998 | 1,109 | 1,134 | 1,121 | 1,268 | 1,337 | 1,437 | 1,451 | 1,177 | 1,303 | 1,389 | 1,244 | 1,214 |
| 1999 | 1,263 | 1,405 | 1,167 | 1,651 | 1,707 | 1,474 | 1,506 | 1,524 | 1,349 | 1,358 | 1,221 | 1,144 |
| 2000 | 1,615 | 1,937 | 1,586 | 1,579 | 1,577 | 1,802 | 1,589 | 1,677 | 1,805 | 1,735 | 1,772 | 2,103 |
| 2001 | 2,613 | 2,353 | 1,829 | 1,785 | 1,929 | 1,859 | 1,687 | 1,712 | 1,846 | 1,552 | 1,673 | 1,552 |
| 2002 | 1,815 | 1,583 | 1,802 | 1,967 | 1,872 | 1,836 | 1,942 | 1,875 | 1,696 | 1,896 | 2,138 | 1,968 |
| 2003 | 2,040 | 2,067 | 2,269 | 2,001 | 2,074 | 2,158 | 2,078 | 2,160 | 1,985 | 1,721 | 1,857 | 1,774 |
| 2004 | 2,033 | 2,553 | 2,609 | 2,225 | 2,310 | 2,356 | 2,559 | 2,523 | 2,226 | 2,514 | 2,511 | 2,369 |
| 2005 | 2,397 | 2,736 | 2,305 | 2,627 | 2,721 | 2,767 | 2,662 | 2,643 | 3,259 | 3,748 | 3,092 | 2,848 |
| 2006 | 3,057 | 2,865 | 2,526 | 2,946 | 3,202 | 2,751 | 3,011 | 3,314 | 3,014 | 2,457 | 2,569 | 2,553 |
| 2007 | 2,872 | 2,625 | 2,940 | 3,022 | 3,135 | 2,949 | 3,314 | 2,759 | 2,717 | 2,695 | 2,564 | 2,525 |
| 2008 | 2,907 | 2,507 | 2,502 | 2,750 | 2,791 | 2,886 | 2,455 | 2,227 | 2,537 | 2,554 | 2,381 | 2,608 |
| 2009 | 2,691 | 2,546 | 2,570 | 2,168 | 2,249 | 2,277 | 2,405 | 2,071 | 2,075 | 2,008 | 2,008 | 2,028 |
| 2010 | 2,506 | 2,098 | 1,954 | 2,395 | 2,143 | 2,216 | 2,399 | 2,423 | 2,227 | 2,285 | 2,054 | 2,003 |
| 2011 | 2,623 | 2,062 | 2,131 | 2,456 | 2,427 | 2,251 | 2,049 | 1,893 | 2,017 | 1,855 | 2,088 | 1,995 |
| 2012 | 2,037 | 1,727 | 1,600 | 1,662 | 1,842 | 1,991 | 1,855 | 1,972 | 1,886 | 1,751 | 1,754 | 1,894 |
| 2013 | 1,858 | 1,825 | 1,874 | 2,126 | 2,154 | 1,933 | 2,007 | 1,872 | 1,882 | 1,953 | 1,778 | 1,555 |
| 2014 | 1,563 | 1,726 | 1,767 | 1,823 | 2,015 | 1,554 | 1,626 | 1,565 | 1,368 | 1,557 | 1,470 | 1,933 |
| 2015 | 2,068 | 1,896 | 1,866 | 1,974 | 1,985 | 2,086 | 2,030 | 1,897 | 1,878 | 1,545 | 1,510 | 1,640 |
| 2016 | 1,854 | 1,901 | 1,684 | 1,948 | 2,011 | 2,215 | 2,135 | 1,998 | 1,898 | 1,909 | 1,952 | 1,776 |
| 2017 | 2,054 | 1,888 | 1,782 | 1,890 | 2,014 | 2,018 | 1,829 | 1,907 | 2,119 | 1,817 | 1,951 | 1,854 |
| 2018 | 1,948 | 1,780 | 1,881 | 1,834 | 2,128 | 1,929 | 1,955 | 2,139 | 1,973 | 1,796 | 1,462 | 1,591 |
| 2019 | 1,931 | 1,802 | 1,962 | 2,372 | 2,601 | 2,005 | 2,451 | 2,283 | 2,064 | 2,254 | 2,199 | 2,230 |
| 2020 | 2,116 | 1,878 | 2,041 | 1,689 | 1,654 | 1,907 | 1,806 | 1,993 | 2,076 | 1,965 | 1,986 | 1,895 |
| 2021 | 2,039 | 1,969 | 2,383 | 2,356 | 2,501 | 2,458 | 2,163 | 2,223 | 2,282 | 2,018 | 2,017 | 1,969 |
| 2022 | 1,680 | 2,143 | 1,916 | 1,841 | 1,765 | 1,752 | 1,785 | 1,735 | 1,499 | 1,627 | 1,760 | 1,797 |
| 2023 | 1,853 | 1,922 | 1,657 | 1,837 | 1,783 | 1,992 | 1,646 | 1,699 | 1,620 | 1,532 | 1,518 | 1,717 |
| 2024 | 1,579 | |||||||||||
| - = No Data Reported; -- = Not Applicable; NA = Not Available; W = Withheld to avoid disclosure of individual company data. |
| Release Date: 3/29/2024 |
| Next Release Date: 4/30/2024 |