|
Download Data (XLS File) |
|
||||||||
|
||||||||
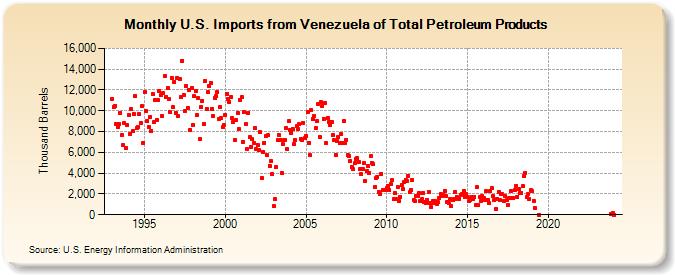
| U.S. Imports from Venezuela of Total Petroleum Products (Thousand Barrels) | ||||||||
| Year | Jan | Feb | Mar | Apr | May | Jun | Jul | Aug | Sep | Oct | Nov | Dec |
|---|---|---|---|---|---|---|---|---|---|---|---|---|
| 1993 | 11,144 | 10,389 | 10,505 | 8,736 | 8,439 | 8,773 | 9,804 | 7,698 | 6,681 | 8,795 | 6,418 | 8,624 |
| 1994 | 9,614 | 7,793 | 10,186 | 8,047 | 9,674 | 11,443 | 8,297 | 8,457 | 9,647 | 8,803 | 10,446 | 6,876 |
| 1995 | 11,799 | 9,957 | 9,010 | 8,449 | 9,448 | 8,100 | 11,592 | 8,903 | 10,993 | 9,120 | 11,003 | 11,926 |
| 1996 | 11,487 | 9,527 | 11,718 | 13,321 | 11,368 | 12,181 | 11,098 | 9,852 | 13,184 | 10,325 | 12,768 | 9,830 |
| 1997 | 13,185 | 9,514 | 13,049 | 11,278 | 14,812 | 11,523 | 9,940 | 12,413 | 10,305 | 11,983 | 8,138 | 12,225 |
| 1998 | 8,594 | 11,401 | 11,938 | 9,597 | 11,215 | 7,246 | 10,340 | 10,976 | 8,712 | 12,855 | 10,216 | 11,774 |
| 1999 | 12,344 | 12,682 | 10,211 | 9,513 | 11,217 | 11,372 | 11,761 | 9,197 | 10,353 | 9,275 | 8,392 | 8,588 |
| 2000 | 9,593 | 11,651 | 11,112 | 10,849 | 11,334 | 9,278 | 8,895 | 7,209 | 9,106 | 9,824 | 8,225 | 11,053 |
| 2001 | 11,292 | 7,022 | 9,845 | 8,723 | 6,275 | 9,785 | 7,436 | 6,544 | 7,238 | 6,919 | 8,367 | 6,307 |
| 2002 | 6,735 | 6,221 | 7,920 | 3,577 | 6,039 | 6,912 | 7,566 | 5,718 | 7,633 | 4,719 | 5,142 | 3,910 |
| 2003 | 825 | 1,512 | 4,612 | 7,172 | 7,640 | 7,231 | 4,012 | 6,790 | 7,217 | 8,318 | 6,288 | 9,007 |
| 2004 | 8,193 | 7,870 | 8,253 | 6,784 | 7,169 | 8,529 | 8,262 | 8,685 | 7,296 | 7,153 | 8,870 | 7,349 |
| 2005 | 7,620 | 9,891 | 6,925 | 5,709 | 10,061 | 9,231 | 9,464 | 8,339 | 9,025 | 10,660 | 7,499 | 10,819 |
| 2006 | 10,485 | 9,240 | 10,768 | 6,882 | 9,342 | 8,954 | 8,604 | 8,921 | 7,700 | 7,167 | 5,775 | 7,108 |
| 2007 | 7,436 | 6,857 | 7,776 | 6,894 | 9,004 | 6,861 | 7,198 | 5,703 | 5,635 | 5,163 | 4,615 | 4,362 |
| 2008 | 4,929 | 5,403 | 5,412 | 5,103 | 4,363 | 3,894 | 4,419 | 4,930 | 3,236 | 4,189 | 4,683 | 4,049 |
| 2009 | 5,613 | 5,017 | 4,846 | 2,631 | 3,502 | 3,664 | 2,213 | 1,954 | 3,958 | 2,368 | 2,422 | 2,383 |
| 2010 | 2,586 | 2,730 | 2,373 | 3,002 | 3,308 | 1,464 | 2,082 | 1,471 | 2,669 | 1,340 | 1,731 | 2,844 |
| 2011 | 2,442 | 3,127 | 3,369 | 3,212 | 3,750 | 2,162 | 2,385 | 3,346 | 1,423 | 1,337 | 1,788 | 1,809 |
| 2012 | 2,130 | 1,281 | 1,466 | 2,075 | 1,236 | 1,146 | 1,449 | 2,193 | 1,082 | 719 | 1,318 | 1,153 |
| 2013 | 1,315 | 998 | 1,186 | 1,626 | 2,010 | 1,823 | 1,933 | 2,314 | 1,799 | 1,178 | 1,107 | 1,511 |
| 2014 | 812 | 1,387 | 1,472 | 2,184 | 1,741 | 1,473 | 1,546 | 1,942 | 2,034 | 2,323 | 1,684 | 1,968 |
| 2015 | 1,726 | 1,327 | 1,438 | 1,660 | 1,473 | 1,686 | 938 | 2,633 | 889 | 1,680 | 1,313 | 1,821 |
| 2016 | 1,602 | 1,388 | 2,255 | 1,417 | 1,102 | 2,246 | 2,563 | 1,789 | 1,433 | 541 | 1,543 | 2,216 |
| 2017 | 1,396 | 2,018 | 1,965 | 1,344 | 1,811 | 1,409 | 953 | 1,585 | 2,237 | 1,596 | 1,588 | 2,349 |
| 2018 | 2,795 | 1,745 | 2,493 | 2,111 | 2,136 | 2,733 | 3,727 | 4,030 | 1,714 | 1,990 | 1,557 | 2,331 |
| 2019 | 2,245 | 1,324 | 689 | 7 | ||||||||
| 2023 | 84 | |||||||||||
| 2024 | 209 | |||||||||||
| - = No Data Reported; -- = Not Applicable; NA = Not Available; W = Withheld to avoid disclosure of individual company data. |
| Release Date: 3/29/2024 |
| Next Release Date: 4/30/2024 |