|
Download Data (XLS File) |
|
||||||||
|
||||||||
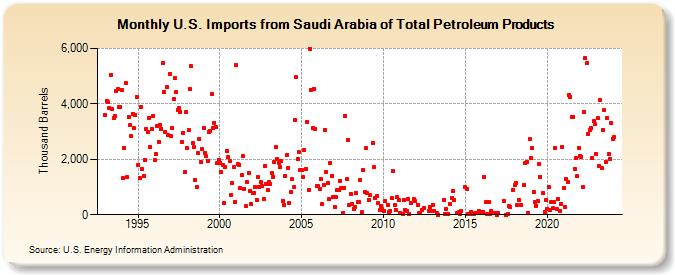
| U.S. Imports from Saudi Arabia of Total Petroleum Products (Thousand Barrels) | ||||||||
| Year | Jan | Feb | Mar | Apr | May | Jun | Jul | Aug | Sep | Oct | Nov | Dec |
|---|---|---|---|---|---|---|---|---|---|---|---|---|
| 1993 | 3,597 | 4,102 | 4,054 | 3,863 | 5,050 | 3,799 | 3,492 | 3,571 | 4,458 | 4,518 | 3,868 | 3,884 |
| 1994 | 4,514 | 1,319 | 2,400 | 4,749 | 1,350 | 3,531 | 3,229 | 2,845 | 3,648 | 3,116 | 3,591 | 4,263 |
| 1995 | 1,811 | 1,313 | 3,891 | 1,633 | 1,390 | 1,965 | 3,096 | 2,970 | 3,505 | 2,445 | 3,088 | 3,554 |
| 1996 | 1,979 | 2,199 | 3,215 | 2,634 | 3,238 | 3,106 | 5,469 | 4,442 | 2,993 | 4,607 | 2,870 | 5,082 |
| 1997 | 2,823 | 3,122 | 4,179 | 4,933 | 4,416 | 3,761 | 3,845 | 3,717 | 2,636 | 2,956 | 1,523 | 3,689 |
| 1998 | 2,409 | 3,064 | 4,531 | 5,348 | 2,570 | 2,427 | 1,255 | 999 | 2,243 | 2,738 | 1,905 | 2,360 |
| 1999 | 3,146 | 2,240 | 2,114 | 1,947 | 2,988 | 3,014 | 4,366 | 3,138 | 3,321 | 3,172 | 1,856 | 1,988 |
| 2000 | 1,873 | 1,532 | 1,811 | 418 | 1,732 | 2,294 | 2,094 | 1,938 | 706 | 1,133 | 1,707 | 467 |
| 2001 | 5,402 | 1,837 | 1,806 | 950 | 1,434 | 2,101 | 938 | 303 | 1,163 | 1,503 | 859 | 382 |
| 2002 | 792 | 786 | 1,015 | 540 | 1,365 | 984 | 1,189 | 1,042 | 560 | 1,754 | 1,106 | 879 |
| 2003 | 1,170 | 1,115 | 1,488 | 1,375 | 1,912 | 2,435 | 1,999 | 1,858 | 1,718 | 1,933 | 501 | 342 |
| 2004 | 1,413 | 2,143 | 1,669 | 432 | 822 | 1,277 | 1,001 | 3,408 | 4,954 | 2,011 | 2,255 | 1,627 |
| 2005 | 1,607 | 1,364 | 2,325 | 1,662 | 3,360 | 909 | 5,992 | 4,516 | 3,115 | 4,547 | 3,099 | 1,040 |
| 2006 | 1,034 | 928 | 1,292 | 369 | 1,073 | 3,057 | 1,530 | 1,159 | 550 | 1,870 | 1,407 | 638 |
| 2007 | 282 | 624 | 875 | 902 | 1,224 | 978 | 76 | 956 | 3,571 | 1,277 | 2,689 | 344 |
| 2008 | 745 | 374 | 222 | 282 | 781 | 474 | 441 | 1,244 | 83 | 1,629 | 805 | 2,394 |
| 2009 | 775 | 540 | 722 | 2,581 | 1,705 | 610 | 673 | 421 | 160 | 330 | 214 | |
| 2010 | 149 | 477 | 367 | 111 | 148 | 607 | 1,592 | 350 | 188 | 638 | 533 | |
| 2011 | 74 | 37 | 522 | 176 | 149 | 584 | 18 | 411 | 569 | 508 | ||
| 2012 | 368 | 67 | 69 | 183 | 249 | 128 | 294 | 128 | ||||
| 2013 | 365 | 117 | 66 | 5 | 540 | 40 | 214 | 20 | ||||
| 2014 | 388 | 598 | 854 | 534 | 45 | 97 | 37 | 150 | ||||
| 2015 | 990 | 945 | 22 | 10 | 103 | 37 | 30 | 45 | 45 | 120 | 87 | |
| 2016 | 89 | 1,377 | 446 | 43 | 460 | 40 | 152 | 49 | 76 | 71 | 4 | |
| 2017 | 45 | 501 | 3 | 22 | 303 | 280 | 900 | |||||
| 2018 | 1,070 | 1,161 | 362 | 543 | 357 | 1,076 | 1,865 | 1,912 | 70 | 2,721 | ||
| 2019 | 2,041 | 2,415 | 808 | 441 | 319 | 497 | 1,826 | 1,370 | 773 | 97 | 526 | |
| 2020 | 209 | 994 | 161 | 449 | 233 | 461 | 2,415 | 206 | 562 | 132 | 398 | 2,454 |
| 2021 | 955 | 287 | 1,285 | 1,183 | 4,336 | 4,241 | 3,540 | 3,529 | 1,659 | 2,039 | 1,379 | 2,407 |
| 2022 | 2,110 | 2,083 | 1,006 | 3,707 | 5,671 | 5,477 | 2,924 | 3,073 | 3,116 | 2,057 | 3,369 | 3,265 |
| 2023 | 2,184 | 3,479 | 1,756 | 4,142 | 1,671 | 3,039 | 3,767 | 1,918 | 3,494 | 2,197 | 2,025 | 3,299 |
| 2024 | 2,747 | |||||||||||
| - = No Data Reported; -- = Not Applicable; NA = Not Available; W = Withheld to avoid disclosure of individual company data. |
| Release Date: 3/29/2024 |
| Next Release Date: 4/30/2024 |