|
Download Data (XLS File) |
|
||||||||
|
||||||||
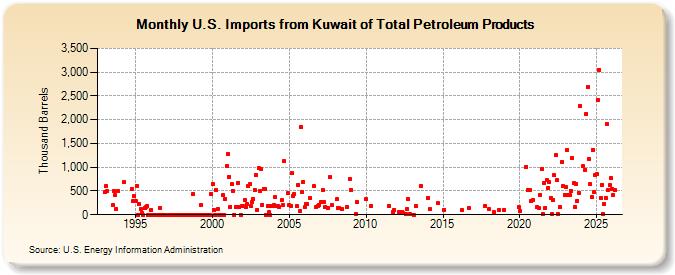
| U.S. Imports from Kuwait of Total Petroleum Products (Thousand Barrels) | ||||||||
| Year | Jan | Feb | Mar | Apr | May | Jun | Jul | Aug | Sep | Oct | Nov | Dec |
|---|---|---|---|---|---|---|---|---|---|---|---|---|
| 1993 | 472 | 604 | 498 | 195 | 500 | 407 | 128 | 495 | ||||
| 1994 | 678 | 548 | 280 | 385 | ||||||||
| 1995 | 297 | 609 | 0 | 223 | 122 | 31 | 0 | 142 | 162 | 179 | 0 | 0 |
| 1996 | 101 | 0 | 0 | 0 | 0 | 0 | 0 | 143 | 0 | 0 | 0 | 0 |
| 1997 | 0 | 0 | 0 | 0 | 0 | 0 | 0 | 0 | 0 | 0 | 0 | 0 |
| 1998 | 0 | 0 | 0 | 0 | 0 | 0 | 0 | 0 | 0 | 432 | 0 | 0 |
| 1999 | 0 | 0 | 0 | 200 | 0 | 0 | 0 | 0 | 0 | 0 | 0 | 440 |
| 2000 | 646 | 102 | 0 | 518 | 125 | 0 | 0 | 0 | 407 | 0 | 328 | 1,021 |
| 2001 | 1,273 | 804 | 167 | 637 | 506 | 0 | 160 | 167 | 677 | 167 | 0 | 180 |
| 2002 | 177 | 319 | 167 | 216 | 604 | 642 | 173 | 270 | 341 | 529 | 834 | 102 |
| 2003 | 985 | 507 | 964 | 210 | 548 | 541 | 0 | 182 | 49 | 0 | 179 | 173 |
| 2004 | 200 | 365 | 182 | 183 | 165 | 300 | 212 | 1,125 | 449 | |||
| 2005 | 199 | 182 | 880 | 404 | 437 | 182 | 629 | 78 | 1,841 | 470 | 697 | |
| 2006 | 171 | 223 | 224 | 357 | 596 | 165 | 182 | 210 | ||||
| 2007 | 270 | 525 | 266 | 169 | 149 | 796 | 204 | |||||
| 2008 | 325 | 136 | 137 | 110 | 165 | 760 | ||||||
| 2009 | 526 | 18 | 260 | |||||||||
| 2010 | 325 | 182 | ||||||||||
| 2011 | 182 | 60 | 106 | |||||||||
| 2012 | 64 | 35 | 64 | 42 | 24 | 121 | 323 | 21 | ||||
| 2013 | 1 | 182 | 604 | |||||||||
| 2014 | 353 | 116 | 238 | |||||||||
| 2015 | 108 | |||||||||||
| 2016 | 90 | 138 | ||||||||||
| 2017 | 181 | |||||||||||
| 2018 | 118 | 47 | 109 | |||||||||
| 2019 | 101 | 152 | ||||||||||
| 2020 | 73 | 1,012 | 519 | 511 | 294 | 306 | ||||||
| 2021 | 157 | 135 | 425 | 959 | 13 | 674 | 142 | 721 | 560 | 695 | ||
| 2022 | 355 | 16 | 308 | 829 | 1,256 | 725 | 19 | 155 | 1,115 | 599 | 415 | |
| 2023 | 583 | 1,370 | 414 | 409 | 498 | 1,193 | 667 | 161 | 652 | 295 | 467 | 2,298 |
| - = No Data Reported; -- = Not Applicable; NA = Not Available; W = Withheld to avoid disclosure of individual company data. |
| Release Date: 3/29/2024 |
| Next Release Date: 4/30/2024 |
Referring Pages: