|
Download Data (XLS File) |
|
||||||||
|
||||||||
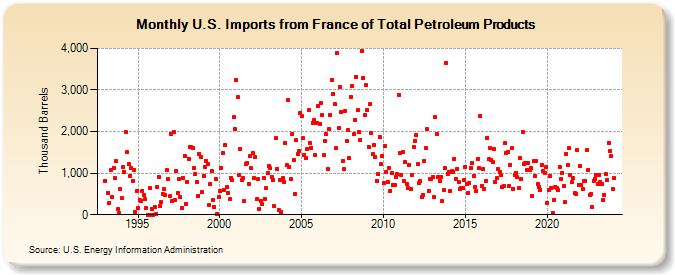
| U.S. Imports from France of Total Petroleum Products (Thousand Barrels) | ||||||||
| Year | Jan | Feb | Mar | Apr | May | Jun | Jul | Aug | Sep | Oct | Nov | Dec |
|---|---|---|---|---|---|---|---|---|---|---|---|---|
| 1993 | 809 | 533 | 284 | 1,071 | 437 | 1,135 | 873 | 1,285 | 131 | 40 | 620 | |
| 1994 | 391 | 1,144 | 1,032 | 1,986 | 1,499 | 1,222 | 942 | 1,112 | 822 | 1,083 | 66 | 569 |
| 1995 | 152 | 344 | 322 | 577 | 484 | 369 | 172 | 0 | 0 | 638 | 149 | 0 |
| 1996 | 192 | 10 | 675 | 915 | 210 | 306 | 508 | 614 | 482 | 1,079 | 856 | 443 |
| 1997 | 1,942 | 322 | 1,990 | 360 | 1,054 | 519 | 868 | 424 | 161 | 885 | 1,409 | 253 |
| 1998 | 788 | 1,346 | 1,640 | 1,617 | 1,594 | 1,128 | 976 | 785 | 453 | 1,467 | 1,397 | 550 |
| 1999 | 924 | 1,156 | 1,296 | 1,213 | 224 | 743 | 1,062 | 354 | 189 | 866 | 11 | 438 |
| 2000 | 559 | 1,133 | 1,477 | 605 | 1,671 | 655 | 522 | 370 | 891 | 834 | 2,339 | 2,052 |
| 2001 | 3,248 | 2,826 | 959 | 1,584 | 845 | 880 | 324 | 1,213 | 1,247 | 750 | 1,410 | 1,115 |
| 2002 | 1,475 | 880 | 1,385 | 367 | 851 | 148 | 339 | 249 | 891 | 384 | 635 | 1,005 |
| 2003 | 1,173 | 1,115 | 911 | 837 | 198 | 1,835 | 1,104 | 104 | 843 | 77 | 881 | 789 |
| 2004 | 1,721 | 1,194 | 2,756 | 1,154 | 848 | 1,940 | 1,319 | 509 | 1,785 | 1,462 | 1,530 | 2,454 |
| 2005 | 2,376 | 1,850 | 1,443 | 1,353 | 1,583 | 2,511 | 1,727 | 1,612 | 2,216 | 2,279 | 1,441 | 2,205 |
| 2006 | 2,619 | 2,191 | 2,686 | 2,390 | 1,426 | 1,782 | 1,931 | 1,100 | 2,057 | 2,393 | 3,247 | 2,914 |
| 2007 | 2,661 | 1,600 | 3,885 | 2,085 | 3,083 | 2,477 | 1,294 | 1,099 | 2,498 | 1,768 | 2,026 | 1,362 |
| 2008 | 2,838 | 3,094 | 1,930 | 2,283 | 3,318 | 2,510 | 1,989 | 1,803 | 3,947 | 3,285 | 2,388 | 3,113 |
| 2009 | 2,519 | 1,631 | 2,653 | 1,960 | 1,458 | 1,665 | 1,393 | 820 | 982 | 1,880 | 1,219 | 1,415 |
| 2010 | 756 | 1,650 | 1,033 | 792 | 1,129 | 579 | 1,010 | 714 | 716 | 910 | 980 | 2,882 |
| 2011 | 1,475 | 951 | 1,514 | 819 | 1,259 | 729 | 643 | 1,196 | 609 | 956 | 1,633 | 1,767 |
| 2012 | 1,921 | 1,210 | 759 | 809 | 421 | 485 | 1,299 | 1,610 | 2,061 | 570 | 850 | 863 |
| 2013 | 903 | 423 | 2,342 | 1,945 | 919 | 805 | 895 | 320 | 602 | 1,117 | 3,654 | 988 |
| 2014 | 1,019 | 564 | 1,051 | 1,025 | 1,341 | 867 | 1,097 | 779 | 624 | 649 | 631 | 846 |
| 2015 | 1,156 | 738 | 530 | 772 | 1,133 | 1,240 | 927 | 671 | 569 | 1,346 | 1,125 | 2,382 |
| 2016 | 699 | 1,103 | 615 | 813 | 1,852 | 1,329 | 1,615 | 1,312 | 1,257 | 1,580 | 785 | 883 |
| 2017 | 1,101 | 1,024 | 947 | 662 | 690 | 1,716 | 1,492 | 1,506 | 691 | 1,201 | 1,598 | 630 |
| 2018 | 948 | 1,013 | 896 | 641 | 1,359 | 869 | 1,991 | 1,229 | 1,255 | 1,072 | 1,239 | 1,085 |
| 2019 | 1,120 | 442 | 1,280 | 922 | 1,282 | 734 | 678 | 606 | 1,197 | 1,049 | 999 | 1,136 |
| 2020 | 292 | 589 | 932 | 633 | 53 | 365 | 677 | 636 | 592 | 1,155 | 847 | 1,013 |
| 2021 | 684 | 294 | 1,470 | 1,187 | 1,595 | 960 | 789 | 880 | 519 | 510 | 1,550 | 721 |
| 2022 | 1,183 | 710 | 614 | 813 | 811 | 1,548 | 1,077 | 481 | 510 | 177 | 813 | 865 |
| 2023 | 949 | 728 | 958 | 784 | 742 | 358 | 477 | 980 | 840 | 1,731 | 1,528 | 1,407 |
| 2024 | 624 | |||||||||||
| - = No Data Reported; -- = Not Applicable; NA = Not Available; W = Withheld to avoid disclosure of individual company data. |
| Release Date: 3/29/2024 |
| Next Release Date: 4/30/2024 |
Referring Pages: