|
Download Data (XLS File) |
|
||||||||
|
||||||||
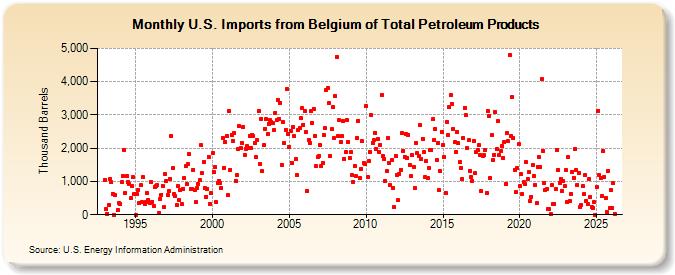
| U.S. Imports from Belgium of Total Petroleum Products (Thousand Barrels) | ||||||||
| Year | Jan | Feb | Mar | Apr | May | Jun | Jul | Aug | Sep | Oct | Nov | Dec |
|---|---|---|---|---|---|---|---|---|---|---|---|---|
| 1993 | 1,049 | 172 | 22 | 301 | 1,070 | 971 | 634 | 6 | 587 | 139 | 359 | |
| 1994 | 318 | 974 | 1,153 | 1,949 | 646 | 1,177 | 989 | 929 | 493 | 857 | 1,121 | 632 |
| 1995 | 0 | 609 | 754 | 347 | 883 | 369 | 1,133 | 336 | 395 | 654 | 442 | 359 |
| 1996 | 988 | 392 | 274 | 837 | 860 | 882 | 46 | 466 | 603 | 869 | 221 | 1,216 |
| 1997 | 1,027 | 601 | 708 | 1,081 | 2,359 | 1,391 | 626 | 558 | 284 | 859 | 435 | 732 |
| 1998 | 322 | 782 | 1,107 | 1,454 | 926 | 1,523 | 1,812 | 768 | 773 | 1,355 | 732 | 373 |
| 1999 | 812 | 920 | 1,039 | 2,084 | 1,245 | 1,579 | 814 | 543 | 787 | 1,750 | 327 | 642 |
| 2000 | 1,853 | 1,273 | 1,432 | 376 | 958 | 1,019 | 953 | 806 | 2,321 | 1,407 | 2,187 | 2,377 |
| 2001 | 591 | 3,111 | 1,353 | 2,406 | 2,221 | 2,449 | 1,023 | 1,180 | 1,962 | 2,665 | 2,011 | 2,169 |
| 2002 | 2,633 | 1,803 | 1,989 | 2,053 | 2,015 | 2,374 | 2,002 | 2,401 | 2,381 | 2,166 | 1,726 | 2,238 |
| 2003 | 3,127 | 1,527 | 2,887 | 1,314 | 2,085 | 2,586 | 2,870 | 2,432 | 2,738 | 2,836 | 2,788 | 2,746 |
| 2004 | 2,546 | 3,069 | 2,843 | 3,457 | 2,892 | 3,364 | 1,499 | 2,793 | 2,152 | 2,551 | 3,784 | 2,427 |
| 2005 | 2,050 | 2,528 | 1,556 | 2,627 | 2,362 | 1,663 | 1,195 | 2,544 | 2,598 | 2,897 | 3,209 | 2,712 |
| 2006 | 3,125 | 2,488 | 713 | 2,251 | 2,150 | 3,103 | 2,750 | 3,187 | 2,371 | 1,455 | 1,736 | 1,778 |
| 2007 | 2,082 | 1,476 | 1,556 | 2,391 | 2,597 | 3,762 | 3,801 | 3,363 | 1,776 | 2,564 | 3,229 | 2,305 |
| 2008 | 3,570 | 4,752 | 2,355 | 2,838 | 2,173 | 2,359 | 2,812 | 1,675 | 1,881 | 2,844 | 2,181 | 1,711 |
| 2009 | 1,875 | 1,179 | 993 | 1,476 | 1,157 | 2,318 | 2,832 | 1,095 | 1,370 | 2,208 | 1,567 | 1,511 |
| 2010 | 3,273 | 1,140 | 1,627 | 1,899 | 3,008 | 2,167 | 2,239 | 2,465 | 1,978 | 2,271 | 1,895 | 2,100 |
| 2011 | 3,608 | 1,765 | 1,673 | 1,006 | 1,308 | 2,305 | 1,564 | 883 | 1,639 | 802 | 229 | 1,769 |
| 2012 | 1,207 | 442 | 1,235 | 1,352 | 2,455 | 1,913 | 1,742 | 2,438 | 1,691 | 2,411 | 1,504 | 1,163 |
| 2013 | 1,789 | 1,444 | 800 | 2,168 | 1,843 | 1,774 | 2,690 | 1,667 | 2,285 | 1,872 | 1,129 | 1,617 |
| 2014 | 1,094 | 1,399 | 1,949 | 1,956 | 2,868 | 2,245 | 2,590 | 1,649 | 2,150 | 738 | 1,308 | 2,500 |
| 2015 | 2,102 | 1,742 | 662 | 2,796 | 2,391 | 3,224 | 3,585 | 3,333 | 2,571 | 2,176 | 1,878 | 2,480 |
| 2016 | 2,153 | 1,591 | 1,418 | 1,070 | 2,310 | 3,220 | 2,987 | 2,003 | 2,233 | 1,324 | 1,139 | 1,024 |
| 2017 | 2,220 | 1,242 | 1,886 | 1,951 | 2,082 | 1,782 | 700 | 1,776 | 1,787 | 1,958 | 660 | 3,122 |
| 2018 | 2,979 | 1,097 | 2,385 | 1,653 | 1,807 | 3,083 | 1,965 | 2,807 | 1,783 | 1,918 | 2,075 | 1,714 |
| 2019 | 2,188 | 936 | 2,451 | 2,207 | 4,803 | 2,368 | 3,534 | 2,305 | 1,357 | 669 | 1,399 | 2,113 |
| 2020 | 867 | 1,209 | 626 | 974 | 922 | 1,580 | 1,077 | 1,273 | 419 | 543 | 1,487 | 1,174 |
| 2021 | 895 | 342 | 1,442 | 1,735 | 1,439 | 4,086 | 1,927 | 940 | 756 | 761 | 181 | 159 |
| 2022 | 7 | 883 | 330 | 323 | 766 | 1,947 | 1,355 | 959 | 1,076 | 722 | 1,008 | 864 |
| 2023 | 1,335 | 371 | 1,722 | 409 | 635 | 1,293 | 1,118 | 1,985 | 1,313 | 904 | 1,247 | 221 |
| 2024 | 289 | |||||||||||
| - = No Data Reported; -- = Not Applicable; NA = Not Available; W = Withheld to avoid disclosure of individual company data. |
| Release Date: 3/29/2024 |
| Next Release Date: 4/30/2024 |
Referring Pages: