|
Download Data (XLS File) |
|
||||||||
|
||||||||
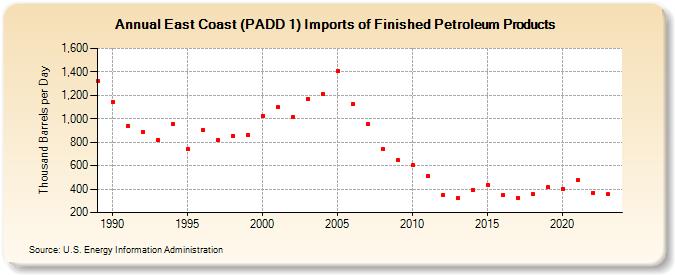
| East Coast (PADD 1) Imports of Finished Petroleum Products (Thousand Barrels per Day) | ||||||||
| Decade | Year-0 | Year-1 | Year-2 | Year-3 | Year-4 | Year-5 | Year-6 | Year-7 | Year-8 | Year-9 |
|---|---|---|---|---|---|---|---|---|---|---|
| 1980's | 1,324 | |||||||||
| 1990's | 1,146 | 940 | 891 | 823 | 959 | 741 | 906 | 817 | 857 | 860 |
| 2000's | 1,027 | 1,099 | 1,014 | 1,171 | 1,208 | 1,411 | 1,126 | 954 | 742 | 646 |
| 2010's | 602 | 513 | 353 | 323 | 396 | 434 | 350 | 327 | 355 | 415 |
| 2020's | 403 | 477 | 370 | 355 |
| - = No Data Reported; -- = Not Applicable; NA = Not Available; W = Withheld to avoid disclosure of individual company data. |
| Release Date: 3/29/2024 |
| Next Release Date: 8/30/2024 |