|
Download Data (XLS File) |
|
||||||||
|
||||||||
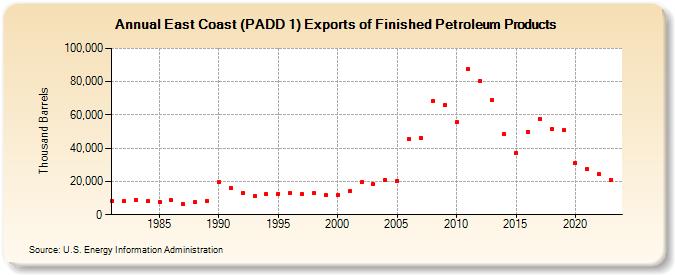
| East Coast (PADD 1) Exports of Finished Petroleum Products (Thousand Barrels) | ||||||||
| Decade | Year-0 | Year-1 | Year-2 | Year-3 | Year-4 | Year-5 | Year-6 | Year-7 | Year-8 | Year-9 |
|---|---|---|---|---|---|---|---|---|---|---|
| 1980's | 8,053 | 8,145 | 9,124 | 8,014 | 7,819 | 8,638 | 6,183 | 7,369 | 8,529 | |
| 1990's | 19,432 | 15,931 | 12,955 | 10,979 | 12,399 | 12,726 | 13,099 | 12,320 | 12,846 | 11,757 |
| 2000's | 11,825 | 13,962 | 19,484 | 18,253 | 21,016 | 20,421 | 45,439 | 46,155 | 68,192 | 65,795 |
| 2010's | 55,500 | 87,541 | 80,398 | 68,693 | 48,357 | 36,829 | 49,768 | 57,785 | 51,237 | 50,763 |
| 2020's | 30,954 | 27,213 | 24,405 | 21,076 |
| - = No Data Reported; -- = Not Applicable; NA = Not Available; W = Withheld to avoid disclosure of individual company data. |
| Release Date: 3/29/2024 |
| Next Release Date: 8/30/2024 |