|
Download Data (XLS File) |
|
||||||||
|
||||||||
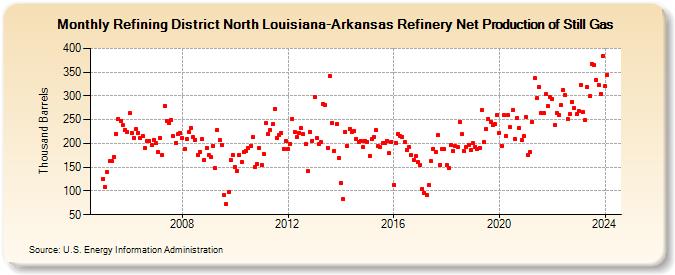
| Refining District North Louisiana-Arkansas Refinery Net Production of Still Gas (Thousand Barrels) | ||||||||
| Year | Jan | Feb | Mar | Apr | May | Jun | Jul | Aug | Sep | Oct | Nov | Dec |
|---|---|---|---|---|---|---|---|---|---|---|---|---|
| 2005 | 126 | 108 | 140 | 162 | 162 | 172 | 220 | 251 | 248 | 238 | 229 | 225 |
| 2006 | 263 | 223 | 212 | 231 | 223 | 212 | 216 | 190 | 205 | 206 | 196 | 208 |
| 2007 | 200 | 181 | 212 | 176 | 279 | 248 | 243 | 250 | 215 | 201 | 219 | 222 |
| 2008 | 211 | 188 | 209 | 225 | 233 | 213 | 208 | 176 | 182 | 209 | 166 | 191 |
| 2009 | 175 | 171 | 195 | 148 | 228 | 207 | 196 | 92 | 72 | 98 | 165 | 176 |
| 2010 | 150 | 143 | 176 | 161 | 181 | 184 | 191 | 195 | 214 | 151 | 156 | 191 |
| 2011 | 154 | 178 | 243 | 220 | 228 | 240 | 273 | 212 | 217 | 222 | 189 | 206 |
| 2012 | 189 | 199 | 252 | 225 | 213 | 222 | 233 | 219 | 199 | 141 | 225 | 206 |
| 2013 | 298 | 211 | 198 | 202 | 284 | 281 | 191 | 342 | 244 | 184 | 240 | 169 |
| 2014 | 117 | 83 | 225 | 195 | 231 | 224 | 227 | 210 | 204 | 206 | 192 | 205 |
| 2015 | 204 | 174 | 209 | 214 | 228 | 194 | 193 | 200 | 200 | 206 | 179 | 204 |
| 2016 | 113 | 201 | 220 | 216 | 214 | 204 | 187 | 193 | 175 | 166 | 173 | 160 |
| 2017 | 154 | 105 | 96 | 92 | 112 | 163 | 189 | 183 | 217 | 155 | 189 | 188 |
| 2018 | 154 | 148 | 197 | 185 | 194 | 193 | 246 | 219 | 184 | 192 | 196 | 186 |
| 2019 | 200 | 193 | 188 | 191 | 270 | 203 | 230 | 252 | 245 | 238 | 240 | 260 |
| 2020 | 223 | 195 | 259 | 216 | 259 | 234 | 270 | 210 | 253 | 232 | 207 | 215 |
| 2021 | 256 | 175 | 182 | 245 | 337 | 295 | 319 | 265 | 263 | 303 | 278 | 297 |
| 2022 | 294 | 238 | 265 | 260 | 281 | 312 | 301 | 251 | 261 | 288 | 274 | 261 |
| 2023 | 269 | 323 | 266 | 249 | 318 | 299 | 368 | 364 | 334 | 324 | 304 | 384 |
| 2024 | 320 | |||||||||||
| - = No Data Reported; -- = Not Applicable; NA = Not Available; W = Withheld to avoid disclosure of individual company data. |
| Release Date: 3/29/2024 |
| Next Release Date: 4/30/2024 |