|
Download Data (XLS File) |
|
||||||||
|
||||||||
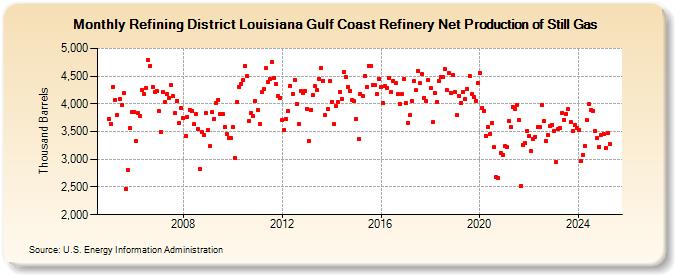
| Refining District Louisiana Gulf Coast Refinery Net Production of Still Gas (Thousand Barrels) | ||||||||
| Year | Jan | Feb | Mar | Apr | May | Jun | Jul | Aug | Sep | Oct | Nov | Dec |
|---|---|---|---|---|---|---|---|---|---|---|---|---|
| 2005 | 3,731 | 3,633 | 4,311 | 4,078 | 3,800 | 4,082 | 3,971 | 4,195 | 2,469 | 2,813 | 3,564 | 3,845 |
| 2006 | 3,853 | 3,336 | 3,836 | 3,787 | 4,256 | 4,178 | 4,289 | 4,794 | 4,690 | 4,304 | 4,207 | 4,234 |
| 2007 | 3,863 | 3,498 | 4,209 | 4,032 | 4,179 | 4,113 | 4,342 | 4,136 | 3,831 | 4,053 | 3,655 | 3,917 |
| 2008 | 3,737 | 3,417 | 3,762 | 3,891 | 3,863 | 3,631 | 3,816 | 3,541 | 2,833 | 3,495 | 3,442 | 3,828 |
| 2009 | 3,526 | 3,231 | 3,856 | 3,728 | 4,023 | 4,078 | 3,814 | 3,817 | 3,584 | 3,461 | 3,378 | 3,387 |
| 2010 | 3,586 | 3,028 | 4,040 | 4,300 | 4,352 | 4,437 | 4,681 | 4,495 | 3,692 | 3,830 | 3,776 | 4,049 |
| 2011 | 3,887 | 3,637 | 4,212 | 4,270 | 4,638 | 4,386 | 4,444 | 4,761 | 4,474 | 4,350 | 4,138 | 4,113 |
| 2012 | 3,707 | 3,534 | 3,721 | 3,873 | 4,326 | 4,183 | 4,433 | 4,001 | 3,632 | 4,229 | 4,202 | 4,238 |
| 2013 | 3,905 | 3,331 | 3,896 | 4,160 | 4,316 | 4,253 | 4,455 | 4,650 | 4,419 | 3,794 | 3,915 | 4,406 |
| 2014 | 4,037 | 3,629 | 3,956 | 4,030 | 4,208 | 4,096 | 4,574 | 4,488 | 4,312 | 4,233 | 4,072 | 4,048 |
| 2015 | 3,730 | 3,362 | 4,186 | 4,143 | 4,499 | 4,304 | 4,687 | 4,691 | 4,336 | 4,337 | 4,179 | 4,455 |
| 2016 | 4,297 | 4,007 | 4,321 | 4,290 | 4,465 | 4,218 | 4,416 | 4,376 | 4,169 | 4,003 | 4,171 | 4,455 |
| 2017 | 4,007 | 3,656 | 3,792 | 4,058 | 4,403 | 4,244 | 4,595 | 4,369 | 4,540 | 4,112 | 4,048 | 4,426 |
| 2018 | 4,278 | 3,672 | 4,201 | 4,032 | 4,415 | 4,478 | 4,484 | 4,622 | 4,241 | 4,551 | 4,200 | 4,518 |
| 2019 | 4,218 | 3,792 | 4,143 | 4,024 | 4,221 | 4,081 | 4,275 | 4,511 | 4,186 | 4,128 | 4,058 | 4,380 |
| 2020 | 4,563 | 3,929 | 3,868 | 3,411 | 3,583 | 3,464 | 3,658 | 3,214 | 2,675 | 2,666 | 3,116 | 3,085 |
| 2021 | 3,231 | 3,216 | 3,688 | 3,582 | 3,948 | 3,915 | 3,978 | 3,704 | 2,520 | 3,266 | 3,289 | 3,511 |
| 2022 | 3,421 | 3,144 | 3,362 | 3,408 | 3,581 | 3,574 | 3,982 | 3,688 | 3,326 | 3,430 | 3,593 | 3,621 |
| 2023 | 3,507 | 2,947 | 3,550 | 3,565 | 3,840 | 3,714 | 3,825 | 3,898 | 3,672 | 3,509 | 3,610 | 3,565 |
| 2024 | 3,528 | 2,965 | 3,080 | 3,248 | 3,711 | 3,988 | ||||||
| - = No Data Reported; -- = Not Applicable; NA = Not Available; W = Withheld to avoid disclosure of individual company data. |
| Release Date: 8/30/2024 |
| Next Release Date: 9/30/2024 |