|
Download Data (XLS File) |
|
||||||||
|
||||||||
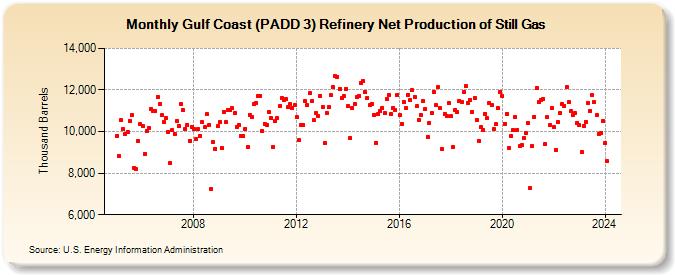
| Gulf Coast (PADD 3) Refinery Net Production of Still Gas (Thousand Barrels) | ||||||||
| Year | Jan | Feb | Mar | Apr | May | Jun | Jul | Aug | Sep | Oct | Nov | Dec |
|---|---|---|---|---|---|---|---|---|---|---|---|---|
| 2005 | 9,786 | 8,819 | 10,538 | 10,124 | 9,899 | 9,975 | 10,523 | 10,782 | 8,267 | 8,175 | 9,549 | 10,362 |
| 2006 | 10,285 | 8,935 | 10,046 | 10,192 | 11,089 | 11,004 | 10,999 | 11,677 | 11,326 | 10,777 | 10,446 | 10,669 |
| 2007 | 9,978 | 8,488 | 10,061 | 9,889 | 10,519 | 10,246 | 11,338 | 11,035 | 10,138 | 10,332 | 9,564 | 10,224 |
| 2008 | 10,122 | 9,649 | 10,115 | 9,808 | 10,442 | 10,201 | 10,832 | 10,323 | 7,241 | 9,476 | 9,184 | 10,246 |
| 2009 | 10,447 | 9,198 | 10,959 | 10,440 | 11,054 | 11,029 | 11,116 | 10,913 | 10,238 | 10,310 | 9,807 | 9,766 |
| 2010 | 10,138 | 9,251 | 10,810 | 10,681 | 11,317 | 11,376 | 11,694 | 11,728 | 10,035 | 10,369 | 10,321 | 10,959 |
| 2011 | 10,636 | 9,261 | 10,522 | 10,630 | 11,219 | 11,614 | 11,537 | 11,546 | 11,175 | 11,304 | 11,146 | 11,283 |
| 2012 | 10,683 | 9,591 | 10,305 | 10,324 | 11,446 | 11,278 | 11,853 | 11,456 | 10,541 | 10,884 | 10,740 | 11,723 |
| 2013 | 11,184 | 9,449 | 10,897 | 11,166 | 11,737 | 12,125 | 12,668 | 12,646 | 12,066 | 11,616 | 11,697 | 12,061 |
| 2014 | 11,229 | 9,699 | 11,124 | 11,332 | 11,665 | 11,687 | 12,326 | 12,437 | 11,889 | 11,614 | 11,256 | 11,338 |
| 2015 | 10,820 | 9,463 | 10,828 | 10,974 | 11,131 | 10,881 | 11,574 | 11,757 | 10,852 | 11,153 | 11,057 | 11,774 |
| 2016 | 10,782 | 10,366 | 11,418 | 11,113 | 11,765 | 11,529 | 11,975 | 11,679 | 11,216 | 10,563 | 10,804 | 11,447 |
| 2017 | 11,076 | 9,754 | 10,435 | 10,884 | 11,924 | 11,264 | 12,120 | 11,115 | 9,152 | 10,856 | 10,764 | 11,366 |
| 2018 | 10,732 | 9,265 | 11,046 | 10,920 | 11,487 | 11,427 | 11,894 | 12,179 | 11,392 | 11,525 | 10,946 | 11,621 |
| 2019 | 10,571 | 9,555 | 10,208 | 10,085 | 10,866 | 10,637 | 11,353 | 11,294 | 10,126 | 10,342 | 11,113 | 11,926 |
| 2020 | 11,705 | 10,384 | 10,859 | 9,203 | 9,787 | 10,070 | 10,697 | 10,072 | 9,300 | 9,340 | 9,682 | 9,923 |
| 2021 | 10,395 | 7,268 | 9,287 | 10,704 | 12,099 | 11,429 | 11,532 | 11,557 | 9,393 | 10,686 | 10,315 | 11,116 |
| 2022 | 10,205 | 9,121 | 10,453 | 10,871 | 11,318 | 11,249 | 12,138 | 11,407 | 10,977 | 10,784 | 10,892 | 10,426 |
| 2023 | 10,303 | 9,017 | 10,288 | 10,461 | 11,381 | 11,000 | 11,746 | 11,417 | 10,786 | 9,902 | 9,947 | 10,506 |
| 2024 | 9,461 | |||||||||||
| - = No Data Reported; -- = Not Applicable; NA = Not Available; W = Withheld to avoid disclosure of individual company data. |
| Release Date: 3/29/2024 |
| Next Release Date: 4/30/2024 |
Referring Pages: