|
Download Data (XLS File) |
|
||||||||
|
||||||||
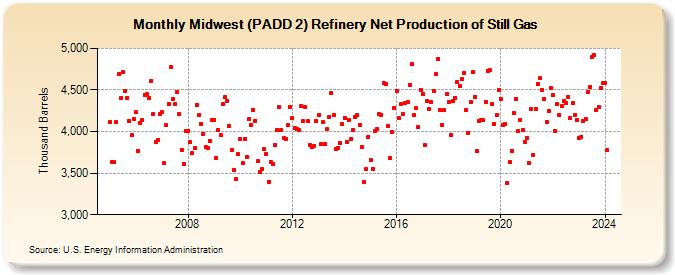
| Midwest (PADD 2) Refinery Net Production of Still Gas (Thousand Barrels) | ||||||||
| Year | Jan | Feb | Mar | Apr | May | Jun | Jul | Aug | Sep | Oct | Nov | Dec |
|---|---|---|---|---|---|---|---|---|---|---|---|---|
| 2005 | 4,113 | 3,636 | 3,632 | 4,115 | 4,688 | 4,403 | 4,712 | 4,489 | 4,408 | 4,129 | 3,959 | 4,148 |
| 2006 | 4,234 | 3,771 | 4,100 | 4,137 | 4,443 | 4,449 | 4,404 | 4,613 | 4,209 | 3,878 | 3,899 | 4,207 |
| 2007 | 4,234 | 3,617 | 4,075 | 4,333 | 4,782 | 4,397 | 4,330 | 4,474 | 4,213 | 3,782 | 3,610 | 4,008 |
| 2008 | 4,012 | 3,872 | 3,742 | 3,799 | 4,315 | 4,197 | 4,089 | 3,968 | 3,819 | 3,800 | 3,890 | 4,138 |
| 2009 | 4,144 | 3,682 | 4,021 | 3,953 | 4,334 | 4,410 | 4,367 | 4,064 | 3,779 | 3,541 | 3,432 | 3,727 |
| 2010 | 3,913 | 3,620 | 3,910 | 3,700 | 4,145 | 4,073 | 4,259 | 4,130 | 3,640 | 3,516 | 3,545 | 3,789 |
| 2011 | 3,727 | 3,397 | 3,634 | 3,607 | 3,841 | 4,021 | 4,291 | 4,018 | 3,924 | 3,911 | 4,075 | 4,299 |
| 2012 | 4,164 | 4,047 | 4,028 | 4,018 | 4,302 | 4,127 | 4,295 | 4,123 | 3,835 | 3,812 | 3,829 | 4,128 |
| 2013 | 4,197 | 3,845 | 4,115 | 3,853 | 4,025 | 4,173 | 4,464 | 4,194 | 3,788 | 3,806 | 3,863 | 4,087 |
| 2014 | 4,164 | 3,870 | 4,143 | 3,915 | 4,024 | 4,173 | 4,194 | 4,082 | 3,820 | 3,395 | 3,544 | 3,937 |
| 2015 | 3,662 | 3,552 | 4,006 | 4,032 | 4,207 | 4,204 | 4,580 | 4,574 | 4,066 | 3,679 | 4,000 | 4,287 |
| 2016 | 4,487 | 4,158 | 4,331 | 4,206 | 4,342 | 4,353 | 4,563 | 4,809 | 4,197 | 4,279 | 4,052 | 4,501 |
| 2017 | 4,451 | 3,835 | 4,370 | 4,272 | 4,351 | 4,489 | 4,693 | 4,876 | 4,263 | 4,081 | 4,255 | 4,450 |
| 2018 | 4,357 | 3,959 | 4,370 | 4,407 | 4,598 | 4,551 | 4,630 | 4,708 | 4,264 | 3,986 | 4,350 | 4,715 |
| 2019 | 4,421 | 3,762 | 4,131 | 4,143 | 4,135 | 4,357 | 4,732 | 4,735 | 4,331 | 4,089 | 4,195 | 4,497 |
| 2020 | 4,391 | 4,081 | 4,096 | 3,385 | 3,635 | 3,771 | 4,220 | 4,393 | 4,002 | 4,139 | 4,013 | 3,877 |
| 2021 | 3,927 | 3,621 | 4,270 | 3,724 | 4,274 | 4,573 | 4,639 | 4,504 | 4,393 | 4,116 | 4,243 | 4,525 |
| 2022 | 4,439 | 4,002 | 4,333 | 4,201 | 4,306 | 4,372 | 4,345 | 4,420 | 4,162 | 4,342 | 4,197 | 4,142 |
| 2023 | 3,925 | 3,939 | 4,123 | 4,154 | 4,475 | 4,537 | 4,902 | 4,919 | 4,258 | 4,293 | 4,522 | 4,587 |
| 2024 | 4,582 | |||||||||||
| - = No Data Reported; -- = Not Applicable; NA = Not Available; W = Withheld to avoid disclosure of individual company data. |
| Release Date: 3/29/2024 |
| Next Release Date: 4/30/2024 |
Referring Pages: