|
Download Data (XLS File) |
|
||||||||
|
||||||||
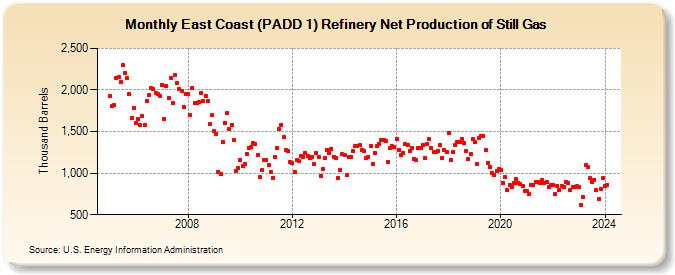
| East Coast (PADD 1) Refinery Net Production of Still Gas (Thousand Barrels) | ||||||||
| Year | Jan | Feb | Mar | Apr | May | Jun | Jul | Aug | Sep | Oct | Nov | Dec |
|---|---|---|---|---|---|---|---|---|---|---|---|---|
| 2005 | 1,933 | 1,805 | 1,822 | 2,139 | 2,155 | 2,092 | 2,302 | 2,202 | 2,141 | 1,949 | 1,667 | 1,786 |
| 2006 | 1,601 | 1,654 | 1,575 | 1,686 | 1,580 | 1,873 | 1,940 | 2,021 | 2,010 | 1,960 | 1,947 | 1,931 |
| 2007 | 2,063 | 1,649 | 2,046 | 1,902 | 2,146 | 1,840 | 2,176 | 2,087 | 2,014 | 1,993 | 1,801 | 1,956 |
| 2008 | 1,952 | 1,695 | 2,023 | 1,843 | 1,849 | 1,855 | 1,968 | 1,871 | 1,929 | 1,869 | 1,593 | 1,696 |
| 2009 | 1,503 | 1,474 | 1,017 | 987 | 1,374 | 1,608 | 1,721 | 1,525 | 1,578 | 1,396 | 1,031 | 1,063 |
| 2010 | 1,160 | 1,085 | 1,107 | 1,233 | 1,301 | 1,311 | 1,357 | 1,351 | 1,220 | 957 | 1,040 | 1,159 |
| 2011 | 1,152 | 1,102 | 1,010 | 946 | 1,195 | 1,302 | 1,529 | 1,577 | 1,434 | 1,276 | 1,262 | 1,130 |
| 2012 | 1,116 | 1,018 | 1,162 | 1,149 | 1,207 | 1,190 | 1,241 | 1,203 | 1,178 | 1,197 | 1,105 | 1,242 |
| 2013 | 1,188 | 967 | 1,047 | 1,181 | 1,280 | 1,243 | 1,295 | 1,199 | 1,179 | 944 | 1,034 | 1,225 |
| 2014 | 1,218 | 974 | 1,190 | 1,199 | 1,267 | 1,330 | 1,323 | 1,337 | 1,278 | 1,269 | 1,185 | 1,198 |
| 2015 | 1,331 | 1,106 | 1,248 | 1,326 | 1,349 | 1,395 | 1,396 | 1,383 | 1,137 | 1,297 | 1,323 | 1,314 |
| 2016 | 1,408 | 1,276 | 1,218 | 1,247 | 1,348 | 1,340 | 1,269 | 1,300 | 1,173 | 1,161 | 1,299 | 1,308 |
| 2017 | 1,343 | 1,184 | 1,351 | 1,405 | 1,297 | 1,251 | 1,255 | 1,268 | 1,344 | 1,177 | 1,284 | 1,254 |
| 2018 | 1,485 | 1,162 | 1,255 | 1,339 | 1,371 | 1,377 | 1,414 | 1,357 | 1,261 | 1,166 | 1,227 | 1,410 |
| 2019 | 1,369 | 1,107 | 1,423 | 1,449 | 1,448 | 1,274 | 1,123 | 1,076 | 1,007 | 978 | 1,030 | 1,044 |
| 2020 | 1,038 | 882 | 953 | 800 | 858 | 837 | 879 | 924 | 881 | 865 | 849 | 781 |
| 2021 | 780 | 748 | 856 | 861 | 896 | 898 | 887 | 915 | 878 | 899 | 832 | 858 |
| 2022 | 861 | 746 | 850 | 800 | 849 | 836 | 891 | 879 | 795 | 831 | 828 | 840 |
| 2023 | 838 | 622 | 708 | 897 | 880 | 861 | 897 | 923 | 794 | 688 | 807 | 942 |
| 2024 | 846 | 862 | 724 | 709 | 956 | 954 | ||||||
| - = No Data Reported; -- = Not Applicable; NA = Not Available; W = Withheld to avoid disclosure of individual company data. |
| Release Date: 8/30/2024 |
| Next Release Date: 9/30/2024 |
Referring Pages: