|
Download Data (XLS File) |
|
||||||||
|
||||||||
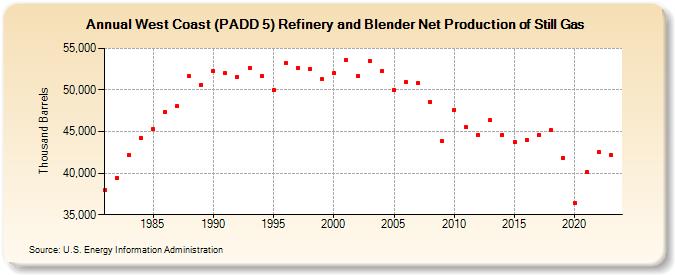
| West Coast (PADD 5) Refinery and Blender Net Production of Still Gas (Thousand Barrels) | ||||||||
| Decade | Year-0 | Year-1 | Year-2 | Year-3 | Year-4 | Year-5 | Year-6 | Year-7 | Year-8 | Year-9 |
|---|---|---|---|---|---|---|---|---|---|---|
| 1980's | 37,914 | 39,413 | 42,151 | 44,261 | 45,262 | 47,379 | 48,022 | 51,634 | 50,643 | |
| 1990's | 52,243 | 51,992 | 51,589 | 52,657 | 51,670 | 49,996 | 53,267 | 52,662 | 52,527 | 51,260 |
| 2000's | 52,005 | 53,633 | 51,709 | 53,478 | 52,278 | 50,010 | 50,929 | 50,852 | 48,601 | 43,861 |
| 2010's | 47,635 | 45,497 | 44,569 | 46,335 | 44,618 | 43,733 | 44,022 | 44,599 | 45,137 | 41,858 |
| 2020's | 36,384 | 40,126 | 42,539 | 42,186 |
| - = No Data Reported; -- = Not Applicable; NA = Not Available; W = Withheld to avoid disclosure of individual company data. |
| Release Date: 3/29/2024 |
| Next Release Date: 8/30/2024 |