|
Download Data (XLS File) |
|
||||||||
|
||||||||
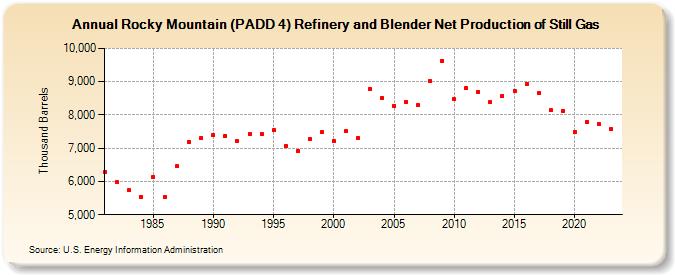
| Rocky Mountain (PADD 4) Refinery and Blender Net Production of Still Gas (Thousand Barrels) | ||||||||
| Decade | Year-0 | Year-1 | Year-2 | Year-3 | Year-4 | Year-5 | Year-6 | Year-7 | Year-8 | Year-9 |
|---|---|---|---|---|---|---|---|---|---|---|
| 1980's | 6,278 | 5,969 | 5,728 | 5,544 | 6,142 | 5,536 | 6,455 | 7,192 | 7,303 | |
| 1990's | 7,394 | 7,373 | 7,203 | 7,428 | 7,428 | 7,540 | 7,061 | 6,910 | 7,282 | 7,472 |
| 2000's | 7,219 | 7,516 | 7,318 | 8,781 | 8,522 | 8,280 | 8,397 | 8,284 | 9,026 | 9,634 |
| 2010's | 8,467 | 8,799 | 8,694 | 8,377 | 8,581 | 8,720 | 8,937 | 8,653 | 8,137 | 8,122 |
| 2020's | 7,487 | 7,783 | 7,716 | 7,573 |
| - = No Data Reported; -- = Not Applicable; NA = Not Available; W = Withheld to avoid disclosure of individual company data. |
| Release Date: 3/29/2024 |
| Next Release Date: 8/30/2024 |