|
Download Data (XLS File) |
|
||||||||
|
||||||||
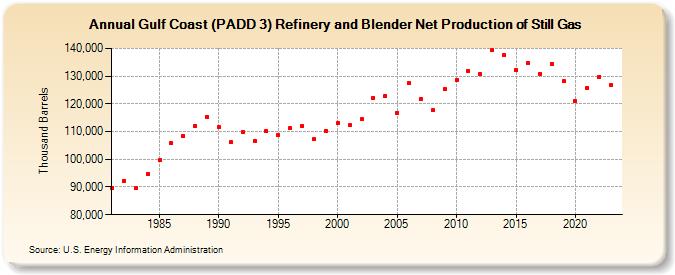
| Gulf Coast (PADD 3) Refinery and Blender Net Production of Still Gas (Thousand Barrels) | ||||||||
| Decade | Year-0 | Year-1 | Year-2 | Year-3 | Year-4 | Year-5 | Year-6 | Year-7 | Year-8 | Year-9 |
|---|---|---|---|---|---|---|---|---|---|---|
| 1980's | 89,620 | 92,342 | 89,467 | 94,638 | 99,663 | 105,759 | 108,315 | 111,953 | 115,256 | |
| 1990's | 111,525 | 106,113 | 109,791 | 106,565 | 110,114 | 108,894 | 111,123 | 112,118 | 107,165 | 110,324 |
| 2000's | 112,967 | 112,247 | 114,383 | 122,168 | 122,826 | 116,799 | 127,445 | 121,812 | 117,639 | 125,277 |
| 2010's | 128,679 | 131,873 | 130,824 | 139,312 | 137,596 | 132,264 | 134,657 | 130,710 | 134,434 | 128,076 |
| 2020's | 121,022 | 125,781 | 129,841 | 126,754 |
| - = No Data Reported; -- = Not Applicable; NA = Not Available; W = Withheld to avoid disclosure of individual company data. |
| Release Date: 3/29/2024 |
| Next Release Date: 8/30/2024 |