|
Download Data (XLS File) |
|
||||||||
|
||||||||
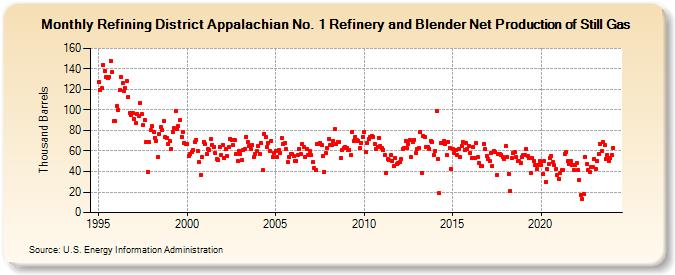
| Refining District Appalachian No. 1 Refinery and Blender Net Production of Still Gas (Thousand Barrels) | ||||||||
| Year | Jan | Feb | Mar | Apr | May | Jun | Jul | Aug | Sep | Oct | Nov | Dec |
|---|---|---|---|---|---|---|---|---|---|---|---|---|
| 1995 | 127 | 119 | 121 | 144 | 138 | 132 | 131 | 132 | 148 | 137 | 89 | 89 |
| 1996 | 104 | 100 | 119 | 132 | 126 | 118 | 121 | 128 | 113 | 97 | 95 | 97 |
| 1997 | 91 | 87 | 96 | 94 | 107 | 96 | 85 | 90 | 69 | 40 | 69 | 80 |
| 1998 | 84 | 79 | 73 | 70 | 54 | 77 | 83 | 80 | 89 | 74 | 73 | 67 |
| 1999 | 70 | 62 | 79 | 82 | 99 | 81 | 84 | 90 | 74 | 79 | 68 | 67 |
| 2000 | 67 | 55 | 57 | 59 | 61 | 69 | 71 | 60 | 49 | 37 | 54 | 69 |
| 2001 | 67 | 57 | 62 | 61 | 72 | 66 | 64 | 58 | 52 | 51 | 64 | 56 |
| 2002 | 66 | 53 | 62 | 55 | 64 | 72 | 71 | 66 | 71 | 57 | 50 | 60 |
| 2003 | 57 | 51 | 61 | 62 | 74 | 69 | 65 | 62 | 66 | 54 | 57 | 60 |
| 2004 | 65 | 57 | 68 | 41 | 77 | 74 | 64 | 68 | 60 | 70 | 54 | 58 |
| 2005 | 60 | 54 | 61 | 58 | 73 | 67 | 68 | 62 | 49 | 54 | 57 | 57 |
| 2006 | 55 | 50 | 50 | 56 | 62 | 57 | 67 | 64 | 54 | 62 | 56 | 60 |
| 2007 | 56 | 49 | 43 | 41 | 67 | 67 | 68 | 66 | 55 | 40 | 58 | 63 |
| 2008 | 72 | 66 | 66 | 70 | 81 | 67 | 69 | 69 | 53 | 61 | 63 | 64 |
| 2009 | 63 | 61 | 61 | 56 | 79 | 70 | 74 | 71 | 70 | 63 | 68 | 74 |
| 2010 | 79 | 59 | 68 | 72 | 74 | 75 | 74 | 67 | 62 | 64 | 73 | 65 |
| 2011 | 63 | 61 | 56 | 39 | 52 | 51 | 56 | 50 | 45 | 53 | 47 | 48 |
| 2012 | 49 | 52 | 62 | 63 | 70 | 63 | 67 | 71 | 54 | 69 | 71 | 58 |
| 2013 | 62 | 63 | 79 | 39 | 75 | 74 | 64 | 64 | 62 | 70 | 69 | 56 |
| 2014 | 60 | 99 | 52 | 19 | 68 | 68 | 70 | 67 | 56 | 69 | 63 | 42 |
| 2015 | 62 | 58 | 61 | 56 | 62 | 54 | 65 | 69 | 61 | 68 | 62 | 65 |
| 2016 | 58 | 53 | 64 | 53 | 68 | 54 | 48 | 45 | 45 | 67 | 62 | 55 |
| 2017 | 52 | 50 | 58 | 45 | 60 | 59 | 37 | 57 | 57 | 56 | 54 | 52 |
| 2018 | 65 | 54 | 38 | 21 | 53 | 58 | 59 | 54 | 50 | 50 | 48 | 54 |
| 2019 | 56 | 56 | 62 | 55 | 53 | 39 | 53 | 50 | 46 | 42 | 46 | 50 |
| 2020 | 46 | 38 | 50 | 30 | 42 | 47 | 53 | 55 | 49 | 46 | 42 | 37 |
| 2021 | 33 | 39 | 41 | 41 | 57 | 59 | 50 | 47 | 50 | 46 | 41 | 46 |
| 2022 | 48 | 41 | 32 | 17 | 13 | 18 | 54 | 47 | 41 | 40 | 44 | 44 |
| 2023 | 52 | 42 | 50 | 57 | 67 | 60 | 69 | 66 | 52 | 56 | 50 | 53 |
| 2024 | 56 | 63 | ||||||||||
| - = No Data Reported; -- = Not Applicable; NA = Not Available; W = Withheld to avoid disclosure of individual company data. |
| Release Date: 4/30/2024 |
| Next Release Date: 5/31/2024 |