|
Download Data (XLS File) |
|
||||||||
|
||||||||
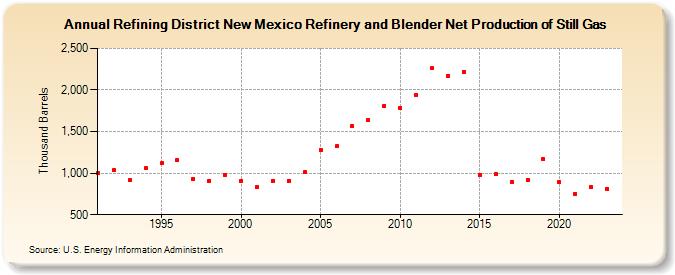
| Refining District New Mexico Refinery and Blender Net Production of Still Gas (Thousand Barrels) | ||||||||
| Decade | Year-0 | Year-1 | Year-2 | Year-3 | Year-4 | Year-5 | Year-6 | Year-7 | Year-8 | Year-9 |
|---|---|---|---|---|---|---|---|---|---|---|
| 1990's | 997 | 1,036 | 917 | 1,061 | 1,116 | 1,156 | 934 | 910 | 981 | |
| 2000's | 908 | 838 | 911 | 909 | 1,008 | 1,284 | 1,323 | 1,564 | 1,637 | 1,811 |
| 2010's | 1,784 | 1,945 | 2,261 | 2,170 | 2,220 | 982 | 989 | 894 | 921 | 1,169 |
| 2020's | 893 | 754 | 829 | 829 |
| - = No Data Reported; -- = Not Applicable; NA = Not Available; W = Withheld to avoid disclosure of individual company data. |
| Release Date: 8/30/2024 |
| Next Release Date: 8/29/2025 |