|
Download Data (XLS File) |
|
||||||||
|
||||||||
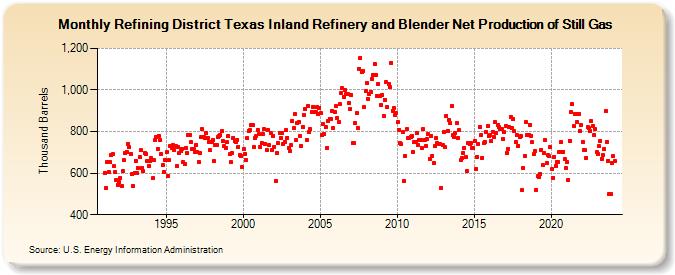
| Refining District Texas Inland Refinery and Blender Net Production of Still Gas (Thousand Barrels) | ||||||||
| Year | Jan | Feb | Mar | Apr | May | Jun | Jul | Aug | Sep | Oct | Nov | Dec |
|---|---|---|---|---|---|---|---|---|---|---|---|---|
| 1991 | 603 | 529 | 653 | 604 | 652 | 687 | 691 | 633 | 604 | 568 | 545 | 558 |
| 1992 | 577 | 538 | 608 | 661 | 699 | 704 | 740 | 725 | 694 | 594 | 538 | 601 |
| 1993 | 660 | 600 | 623 | 678 | 711 | 626 | 609 | 699 | 693 | 658 | 634 | 659 |
| 1994 | 671 | 575 | 665 | 758 | 775 | 717 | 781 | 761 | 691 | 637 | 607 | 663 |
| 1995 | 700 | 586 | 663 | 729 | 722 | 734 | 713 | 730 | 636 | 724 | 699 | 708 |
| 1996 | 718 | 653 | 643 | 722 | 698 | 783 | 785 | 748 | 718 | 715 | 701 | 737 |
| 1997 | 703 | 653 | 695 | 772 | 811 | 773 | 767 | 792 | 769 | 752 | 710 | 748 |
| 1998 | 758 | 657 | 736 | 735 | 773 | 777 | 783 | 801 | 753 | 729 | 721 | 748 |
| 1999 | 778 | 690 | 652 | 698 | 769 | 753 | 749 | 761 | 727 | 687 | 683 | 631 |
| 2000 | 716 | 694 | 664 | 768 | 805 | 806 | 830 | 832 | 725 | 770 | 781 | 808 |
| 2001 | 788 | 727 | 747 | 789 | 810 | 741 | 711 | 808 | 734 | 794 | 710 | 780 |
| 2002 | 728 | 563 | 695 | 744 | 794 | 771 | 791 | 739 | 752 | 807 | 771 | 721 |
| 2003 | 705 | 733 | 853 | 816 | 883 | 758 | 839 | 848 | 779 | 732 | 823 | 881 |
| 2004 | 908 | 760 | 921 | 800 | 811 | 892 | 920 | 896 | 893 | 916 | 883 | 914 |
| 2005 | 887 | 782 | 835 | 788 | 821 | 722 | 851 | 862 | 861 | 901 | 817 | 894 |
| 2006 | 921 | 865 | 847 | 932 | 986 | 1,008 | 967 | 1,001 | 982 | 979 | 939 | 908 |
| 2007 | 977 | 745 | 743 | 841 | 889 | 817 | 1,103 | 1,156 | 1,085 | 1,090 | 917 | 993 |
| 2008 | 1,034 | 958 | 983 | 991 | 1,051 | 1,073 | 1,125 | 1,070 | 973 | 1,031 | 969 | 928 |
| 2009 | 978 | 874 | 954 | 1,036 | 918 | 1,031 | 1,013 | 1,130 | 901 | 913 | 878 | 889 |
| 2010 | 845 | 809 | 745 | 738 | 796 | 561 | 683 | 811 | 768 | 768 | 776 | 778 |
| 2011 | 703 | 750 | 752 | 791 | 735 | 760 | 760 | 722 | 811 | 760 | 731 | 765 |
| 2012 | 787 | 667 | 781 | 684 | 649 | 729 | 767 | 745 | 740 | 739 | 529 | 735 |
| 2013 | 798 | 724 | 877 | 804 | 857 | 841 | 924 | 782 | 775 | 792 | 842 | 768 |
| 2014 | 806 | 661 | 674 | 698 | 722 | 677 | 609 | 743 | 741 | 746 | 721 | 720 |
| 2015 | 756 | 621 | 679 | 740 | 822 | 782 | 675 | 743 | 752 | 798 | 826 | 780 |
| 2016 | 784 | 754 | 797 | 774 | 845 | 792 | 833 | 820 | 810 | 810 | 766 | 796 |
| 2017 | 828 | 698 | 715 | 823 | 871 | 816 | 860 | 801 | 750 | 782 | 732 | 776 |
| 2018 | 777 | 517 | 624 | 683 | 844 | 783 | 783 | 833 | 779 | 748 | 690 | 705 |
| 2019 | 519 | 585 | 580 | 597 | 712 | 637 | 698 | 759 | 650 | 685 | 681 | 726 |
| 2020 | 618 | 578 | 679 | 634 | 653 | 655 | 702 | 749 | 700 | 703 | 666 | 623 |
| 2021 | 653 | 567 | 756 | 894 | 931 | 825 | 886 | 883 | 844 | 886 | 803 | 833 |
| 2022 | 750 | 712 | 709 | 675 | 820 | 817 | 801 | 850 | 828 | 783 | 812 | 700 |
| 2023 | 694 | 729 | 756 | 670 | 686 | 716 | 900 | 752 | 660 | 501 | 498 | 651 |
| 2024 | 681 | |||||||||||
| - = No Data Reported; -- = Not Applicable; NA = Not Available; W = Withheld to avoid disclosure of individual company data. |
| Release Date: 3/29/2024 |
| Next Release Date: 4/30/2024 |