|
Download Data (XLS File) |
|
||||||||
|
||||||||
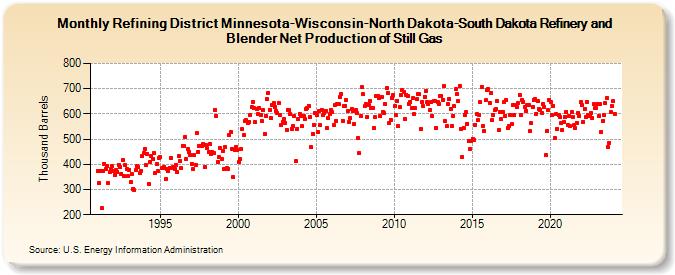
| Refining District Minnesota-Wisconsin-North Dakota-South Dakota Refinery and Blender Net Production of Still Gas (Thousand Barrels) | ||||||||
| Year | Jan | Feb | Mar | Apr | May | Jun | Jul | Aug | Sep | Oct | Nov | Dec |
|---|---|---|---|---|---|---|---|---|---|---|---|---|
| 1991 | 374 | 326 | 373 | 226 | 375 | 402 | 382 | 395 | 324 | 368 | 381 | 392 |
| 1992 | 375 | 358 | 379 | 371 | 399 | 389 | 362 | 416 | 353 | 396 | 381 | 353 |
| 1993 | 379 | 328 | 362 | 304 | 298 | 376 | 393 | 388 | 364 | 375 | 431 | 444 |
| 1994 | 462 | 397 | 442 | 323 | 410 | 432 | 421 | 444 | 366 | 400 | 373 | 426 |
| 1995 | 428 | 386 | 386 | 391 | 340 | 381 | 372 | 386 | 426 | 387 | 390 | 381 |
| 1996 | 396 | 368 | 431 | 414 | 385 | 473 | 472 | 509 | 421 | 459 | 450 | 437 |
| 1997 | 403 | 381 | 436 | 398 | 523 | 450 | 474 | 472 | 472 | 481 | 389 | 476 |
| 1998 | 463 | 449 | 481 | 439 | 449 | 443 | 617 | 591 | 410 | 427 | 463 | 422 |
| 1999 | 454 | 382 | 467 | 384 | 383 | 515 | 527 | 461 | 349 | 455 | 469 | 455 |
| 2000 | 408 | 420 | 459 | 539 | 515 | 572 | 574 | 564 | 568 | 595 | 627 | 649 |
| 2001 | 622 | 566 | 620 | 599 | 623 | 595 | 572 | 614 | 521 | 593 | 659 | 684 |
| 2002 | 617 | 582 | 637 | 642 | 628 | 613 | 603 | 643 | 596 | 554 | 567 | 580 |
| 2003 | 563 | 538 | 617 | 614 | 599 | 542 | 553 | 592 | 412 | 542 | 578 | 601 |
| 2004 | 592 | 550 | 593 | 578 | 619 | 622 | 632 | 588 | 467 | 521 | 557 | 605 |
| 2005 | 594 | 527 | 610 | 554 | 617 | 597 | 603 | 613 | 545 | 585 | 598 | 616 |
| 2006 | 608 | 554 | 635 | 572 | 638 | 639 | 668 | 679 | 572 | 631 | 633 | 654 |
| 2007 | 612 | 568 | 584 | 619 | 611 | 559 | 616 | 603 | 504 | 444 | 590 | 705 |
| 2008 | 677 | 630 | 640 | 588 | 637 | 653 | 622 | 624 | 546 | 588 | 671 | 672 |
| 2009 | 662 | 590 | 668 | 609 | 603 | 638 | 703 | 683 | 562 | 576 | 665 | 674 |
| 2010 | 630 | 595 | 653 | 551 | 626 | 676 | 693 | 688 | 579 | 676 | 670 | 641 |
| 2011 | 649 | 622 | 662 | 599 | 622 | 659 | 679 | 677 | 539 | 647 | 631 | 669 |
| 2012 | 690 | 649 | 639 | 614 | 649 | 590 | 650 | 650 | 546 | 649 | 641 | 670 |
| 2013 | 670 | 656 | 709 | 570 | 550 | 639 | 660 | 621 | 553 | 593 | 630 | 697 |
| 2014 | 679 | 650 | 712 | 542 | 428 | 546 | 597 | 606 | 561 | 492 | 460 | 492 |
| 2015 | 502 | 496 | 557 | 598 | 576 | 597 | 646 | 708 | 550 | 533 | 654 | 695 |
| 2016 | 699 | 645 | 684 | 574 | 596 | 616 | 619 | 650 | 535 | 608 | 578 | 606 |
| 2017 | 648 | 592 | 655 | 544 | 552 | 594 | 559 | 635 | 596 | 636 | 626 | 643 |
| 2018 | 675 | 594 | 657 | 648 | 626 | 613 | 634 | 634 | 531 | 563 | 628 | 657 |
| 2019 | 659 | 601 | 651 | 620 | 617 | 604 | 641 | 629 | 436 | 532 | 614 | 656 |
| 2020 | 649 | 594 | 633 | 504 | 599 | 541 | 596 | 589 | 562 | 537 | 569 | 588 |
| 2021 | 609 | 556 | 593 | 550 | 606 | 586 | 554 | 546 | 565 | 604 | 592 | 646 |
| 2022 | 634 | 568 | 621 | 588 | 647 | 596 | 590 | 604 | 582 | 638 | 622 | 624 |
| 2023 | 641 | 592 | 638 | 528 | 571 | 594 | 642 | 664 | 470 | 486 | 607 | 633 |
| 2024 | 650 | |||||||||||
| - = No Data Reported; -- = Not Applicable; NA = Not Available; W = Withheld to avoid disclosure of individual company data. |
| Release Date: 3/29/2024 |
| Next Release Date: 4/30/2024 |