|
Download Data (XLS File) |
|
||||||||
|
||||||||
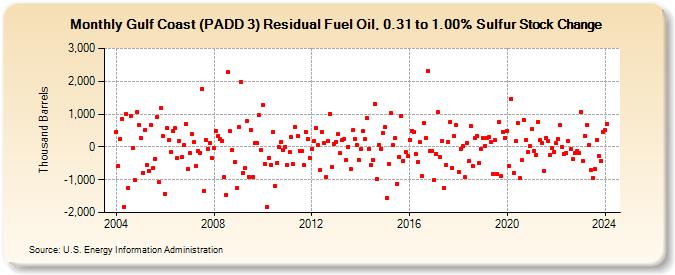
| Gulf Coast (PADD 3) Residual Fuel Oil, 0.31 to 1.00% Sulfur Stock Change (Thousand Barrels) | ||||||||
| Year | Jan | Feb | Mar | Apr | May | Jun | Jul | Aug | Sep | Oct | Nov | Dec |
|---|---|---|---|---|---|---|---|---|---|---|---|---|
| 2004 | 462 | -572 | 254 | 844 | -1,823 | 998 | -1,264 | 944 | -44 | -1,020 | 1,054 | 673 |
| 2005 | 278 | -785 | 510 | -552 | -725 | 664 | -634 | -357 | 915 | -1,084 | 1,184 | 329 |
| 2006 | -1,429 | 572 | 201 | -141 | 477 | 567 | -325 | 170 | -319 | 51 | 691 | -666 |
| 2007 | -186 | 381 | 138 | -576 | -112 | -180 | 1,775 | -1,357 | 215 | -58 | 118 | -345 |
| 2008 | -34 | 487 | 319 | 227 | 193 | -916 | -1,453 | 2,279 | 470 | -103 | -464 | -1,241 |
| 2009 | 600 | 1,988 | -798 | -653 | 788 | -908 | 511 | -905 | 112 | 116 | 957 | -87 |
| 2010 | 1,270 | -507 | -1,833 | -334 | -556 | 451 | -1,180 | -483 | -13 | 149 | -96 | 4 |
| 2011 | -552 | -169 | 303 | -530 | 613 | 326 | -112 | -129 | -554 | 456 | 242 | -324 |
| 2012 | -59 | 167 | 588 | 63 | -710 | 461 | 119 | -921 | 185 | 1,017 | -612 | 97 |
| 2013 | 159 | 381 | -189 | 212 | 241 | -403 | 2 | -676 | 502 | 250 | 60 | -386 |
| 2014 | -70 | 479 | 252 | 865 | -51 | -541 | -393 | 1,320 | -992 | 72 | -62 | 436 |
| 2015 | 592 | -1,557 | -516 | 1,035 | 56 | 268 | -1,124 | -301 | 956 | -428 | -154 | -290 |
| 2016 | 221 | 486 | 460 | -212 | -458 | 137 | -872 | 717 | 273 | 2,308 | -130 | -124 |
| 2017 | -1,016 | -208 | 1,054 | -307 | 167 | -1,238 | -545 | 146 | 757 | -631 | 326 | 673 |
| 2018 | -757 | -62 | 19 | -931 | 127 | -439 | 646 | -584 | 262 | 338 | -497 | -50 |
| 2019 | 277 | 28 | 286 | 296 | 151 | -815 | 217 | -814 | 749 | -879 | 462 | 279 |
| 2020 | 491 | -567 | 1,457 | -790 | 169 | 719 | -961 | -407 | 834 | 210 | -142 | 21 |
| 2021 | 558 | -116 | -247 | 771 | 196 | 105 | -723 | 280 | 177 | -238 | -48 | -141 |
| 2022 | 109 | 237 | 663 | 8 | -222 | -173 | 173 | -77 | -382 | -195 | -115 | -183 |
| 2023 | 1,063 | -423 | 328 | 680 | 49 | -719 | -938 | -679 | 216 | -279 | -422 | 449 |
| 2024 | 501 | |||||||||||
| - = No Data Reported; -- = Not Applicable; NA = Not Available; W = Withheld to avoid disclosure of individual company data. |
| Release Date: 3/29/2024 |
| Next Release Date: 4/30/2024 |