|
Download Data (XLS File) |
|
||||||||
|
||||||||
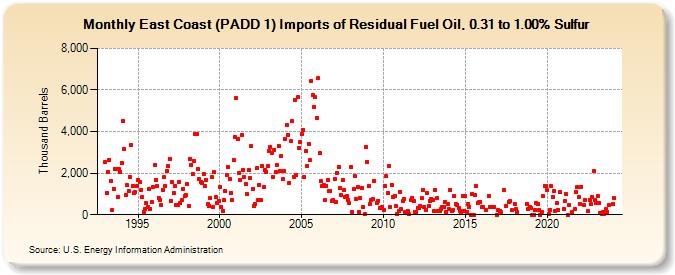
| East Coast (PADD 1) Imports of Residual Fuel Oil, 0.31 to 1.00% Sulfur (Thousand Barrels) | ||||||||
| Year | Jan | Feb | Mar | Apr | May | Jun | Jul | Aug | Sep | Oct | Nov | Dec |
|---|---|---|---|---|---|---|---|---|---|---|---|---|
| 1993 | 2,513 | 1,057 | 2,065 | 2,647 | 1,606 | 234 | 1,241 | 2,219 | 2,210 | 853 | 2,176 | 2,069 |
| 1994 | 2,499 | 4,493 | 3,158 | 931 | 1,419 | 1,142 | 1,834 | 3,358 | 1,396 | 1,051 | 1,080 | 1,399 |
| 1995 | 1,667 | 1,580 | 1,187 | 828 | 135 | 252 | 541 | 351 | 1,236 | 294 | 627 | 1,346 |
| 1996 | 2,374 | 1,692 | 1,372 | 822 | 728 | 472 | 1,202 | 1,802 | 1,383 | 2,116 | 2,349 | 2,698 |
| 1997 | 669 | 1,567 | 1,045 | 1,399 | 489 | 472 | 1,559 | 568 | 707 | 1,255 | 887 | 961 |
| 1998 | 1,458 | 405 | 2,685 | 2,389 | 1,959 | 2,603 | 3,885 | 3,881 | 2,197 | 1,715 | 1,592 | 1,532 |
| 1999 | 1,967 | 1,380 | 1,670 | 503 | 432 | 812 | 1,794 | 359 | 2,033 | 831 | 582 | 676 |
| 2000 | 1,323 | 369 | 198 | 685 | 1,144 | 1,909 | 2,285 | 1,718 | 1,035 | 691 | 2,651 | 3,736 |
| 2001 | 5,625 | 3,628 | 1,996 | 1,679 | 3,819 | 2,155 | 1,792 | 1,498 | 990 | 2,143 | 1,763 | 3,291 |
| 2002 | 1,244 | 409 | 503 | 2,228 | 717 | 1,451 | 709 | 2,365 | 1,346 | 2,139 | 2,055 | 2,348 |
| 2003 | 3,063 | 3,265 | 2,971 | 1,810 | 3,125 | 2,038 | 2,383 | 3,308 | 2,095 | 2,824 | 1,702 | 2,098 |
| 2004 | 3,620 | 4,297 | 3,857 | 1,549 | 3,524 | 4,491 | 1,817 | 5,507 | 1,928 | 5,644 | 3,219 | 3,490 |
| 2005 | 3,863 | 4,088 | 1,822 | 3,050 | 2,344 | 3,424 | 2,618 | 6,440 | 5,754 | 5,193 | 5,643 | 4,640 |
| 2006 | 6,553 | 2,977 | 1,612 | 1,373 | 1,420 | 721 | 1,400 | 1,673 | 1,140 | 1,163 | 671 | 700 |
| 2007 | 1,706 | 618 | 1,996 | 2,317 | 1,268 | 927 | 1,659 | 1,175 | 849 | 881 | 729 | 544 |
| 2008 | 2,310 | 146 | 1,231 | 1,871 | 751 | 1,330 | 153 | 786 | 1,302 | 375 | 19 | 3,260 |
| 2009 | 2,542 | 1,381 | 504 | 720 | 748 | 1,613 | 578 | 665 | 326 | 329 | 371 | |
| 2010 | 238 | 1,371 | 1,847 | 1,030 | 2,321 | 370 | 1,445 | 856 | 898 | 414 | 30 | 168 |
| 2011 | 1,106 | 256 | 659 | 769 | 120 | 110 | 175 | 11 | 693 | 808 | 657 | 137 |
| 2012 | 113 | 340 | 315 | 400 | 785 | 1,188 | 386 | 231 | 1,039 | 414 | 646 | 779 |
| 2013 | 695 | 177 | 1,205 | 788 | 175 | 181 | 276 | 357 | 373 | 615 | 113 | 506 |
| 2014 | 257 | 1,187 | 185 | 224 | 893 | 496 | 488 | 328 | 198 | 92 | 886 | 180 |
| 2015 | 887 | 147 | 526 | 371 | 5 | 999 | 5 | 960 | 1,394 | 559 | 598 | 628 |
| 2016 | 352 | 370 | 250 | 896 | 380 | 385 | 379 | 366 | 1 | |||
| 2017 | 236 | 200 | 144 | 1,174 | 411 | 634 | 653 | 204 | ||||
| 2018 | 506 | 253 | 125 | 535 | 260 | 376 | ||||||
| 2019 | 299 | 4 | 1 | 228 | 580 | 511 | 241 | 1 | 137 | 880 | 1,405 | 1,363 |
| 2020 | 1,183 | 56 | 237 | 1,360 | 873 | 1,134 | 191 | 565 | 215 | 1,069 | ||
| 2021 | 277 | 647 | 973 | 2 | 458 | 128 | 266 | 1,082 | 1,347 | 875 | ||
| 2022 | 515 | 1,357 | 464 | 730 | 160 | 724 | 497 | 866 | 2,105 | 689 | ||
| 2023 | 579 | 895 | 546 | 66 | 53 | 121 | 46 | 251 | 149 | 468 | ||
| 2024 | 511 | |||||||||||
| - = No Data Reported; -- = Not Applicable; NA = Not Available; W = Withheld to avoid disclosure of individual company data. |
| Release Date: 3/29/2024 |
| Next Release Date: 4/30/2024 |