|
Download Data (XLS File) |
|
||||||||
|
||||||||
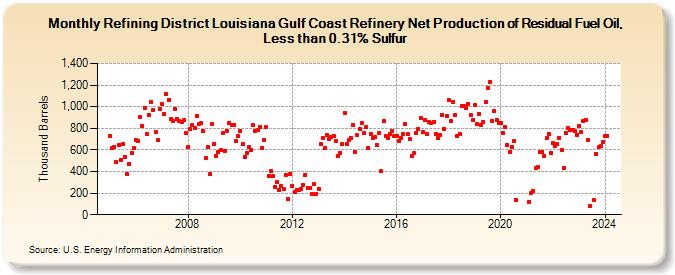
| Refining District Louisiana Gulf Coast Refinery Net Production of Residual Fuel Oil, Less than 0.31% Sulfur (Thousand Barrels) | ||||||||
| Year | Jan | Feb | Mar | Apr | May | Jun | Jul | Aug | Sep | Oct | Nov | Dec |
|---|---|---|---|---|---|---|---|---|---|---|---|---|
| 2005 | 732 | 615 | 627 | 485 | 647 | 511 | 652 | 537 | 376 | 474 | 573 | 613 |
| 2006 | 696 | 684 | 901 | 820 | 984 | 745 | 923 | 1,046 | 973 | 764 | 689 | 977 |
| 2007 | 1,026 | 931 | 1,117 | 1,062 | 886 | 869 | 981 | 885 | 868 | 859 | 877 | 754 |
| 2008 | 624 | 794 | 832 | 800 | 915 | 844 | 848 | 774 | 523 | 628 | 377 | 836 |
| 2009 | 655 | 541 | 582 | 596 | 752 | 593 | 775 | 846 | 826 | 834 | 678 | 727 |
| 2010 | 779 | 653 | 534 | 574 | 629 | 603 | 827 | 778 | 784 | 809 | 621 | 692 |
| 2011 | 809 | 363 | 407 | 355 | 255 | 300 | 232 | 263 | 240 | 370 | 141 | 378 |
| 2012 | 268 | 211 | 228 | 229 | 238 | 279 | 365 | 245 | 251 | 190 | 286 | 196 |
| 2013 | 239 | 653 | 712 | 620 | 736 | 702 | 716 | 733 | 679 | 548 | 575 | 652 |
| 2014 | 942 | 650 | 691 | 708 | 835 | 576 | 739 | 794 | 851 | 761 | 810 | 620 |
| 2015 | 745 | 714 | 719 | 648 | 752 | 401 | 868 | 732 | 710 | 750 | 771 | 732 |
| 2016 | 732 | 678 | 708 | 751 | 838 | 744 | 700 | 539 | 568 | 759 | 795 | 895 |
| 2017 | 765 | 873 | 751 | 856 | 848 | 857 | 748 | 706 | 738 | 926 | 797 | 913 |
| 2018 | 1,058 | 863 | 1,048 | 926 | 729 | 747 | 1,004 | 1,011 | 992 | 1,022 | 921 | 878 |
| 2019 | 1,012 | 836 | 934 | 828 | 862 | 1,047 | 1,173 | 1,230 | 867 | 956 | 878 | 845 |
| 2020 | 845 | 759 | 814 | 647 | 577 | 629 | 678 | 135 | ||||
| 2021 | 118 | 198 | 221 | 434 | 438 | 582 | 580 | 545 | 708 | 749 | 571 | |
| 2022 | 663 | 638 | 654 | 713 | 600 | 428 | 755 | 807 | 781 | 787 | 771 | 741 |
| 2023 | 825 | 762 | 865 | 880 | 696 | 81 | 135 | 563 | 625 | 637 | 675 | |
| 2024 | 728 | |||||||||||
| - = No Data Reported; -- = Not Applicable; NA = Not Available; W = Withheld to avoid disclosure of individual company data. |
| Release Date: 3/29/2024 |
| Next Release Date: 4/30/2024 |