|
Download Data (XLS File) |
|
||||||||
|
||||||||
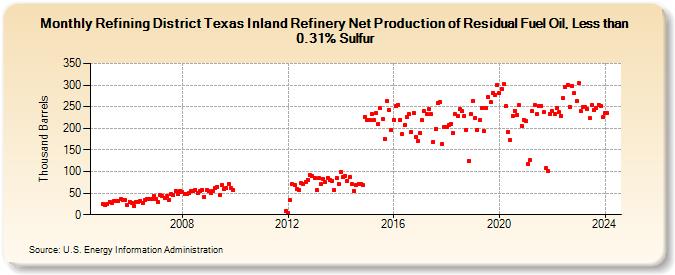
| Refining District Texas Inland Refinery Net Production of Residual Fuel Oil, Less than 0.31% Sulfur (Thousand Barrels) | ||||||||
| Year | Jan | Feb | Mar | Apr | May | Jun | Jul | Aug | Sep | Oct | Nov | Dec |
|---|---|---|---|---|---|---|---|---|---|---|---|---|
| 2005 | 25 | 22 | 24 | 30 | 28 | 31 | 31 | 32 | 36 | 34 | 34 | 23 |
| 2006 | 30 | 28 | 20 | 29 | 29 | 32 | 27 | 33 | 37 | 37 | 37 | 44 |
| 2007 | 37 | 29 | 45 | 44 | 39 | 43 | 35 | 48 | 45 | 55 | 47 | 56 |
| 2008 | 53 | 48 | 47 | 50 | 55 | 54 | 58 | 51 | 54 | 58 | 41 | 57 |
| 2009 | 54 | 51 | 56 | 62 | 65 | 46 | 69 | 59 | 61 | 72 | 61 | 57 |
| 2010 | 57 | 81 | 15 | 15 | 9 | 11 | ||||||
| 2011 | 9 | |||||||||||
| 2012 | 4 | 34 | 71 | 69 | 60 | 58 | 73 | 72 | 76 | 81 | 91 | 89 |
| 2013 | 85 | 57 | 84 | 71 | 83 | 75 | 85 | 81 | 77 | 57 | 86 | 72 |
| 2014 | 100 | 88 | 90 | 79 | 87 | 70 | 55 | 68 | 72 | 70 | 68 | 227 |
| 2015 | 220 | 219 | 233 | 219 | 235 | 211 | 246 | 222 | 176 | 263 | 242 | 196 |
| 2016 | 220 | 252 | 255 | 220 | 186 | 207 | 225 | 233 | 192 | 236 | 181 | 170 |
| 2017 | 190 | 219 | 239 | 234 | 244 | 232 | 169 | 199 | 258 | 260 | 164 | 202 |
| 2018 | 203 | 207 | 211 | 188 | 232 | 229 | 244 | 239 | 228 | 196 | 125 | 232 |
| 2019 | 263 | 224 | 197 | 219 | 247 | 194 | 247 | 272 | 260 | 282 | 278 | 300 |
| 2020 | 281 | 292 | 302 | 251 | 192 | 172 | 229 | 241 | 231 | 253 | 206 | 220 |
| 2021 | 216 | 117 | 126 | 239 | 254 | 232 | 251 | 252 | 237 | 107 | 101 | 233 |
| 2022 | 239 | 232 | 246 | 237 | 229 | 269 | 295 | 300 | 250 | 298 | 281 | 263 |
| 2023 | 304 | 240 | 249 | 249 | 245 | 223 | 254 | 242 | 248 | 254 | 252 | 225 |
| 2024 | 236 | |||||||||||
| - = No Data Reported; -- = Not Applicable; NA = Not Available; W = Withheld to avoid disclosure of individual company data. |
| Release Date: 3/29/2024 |
| Next Release Date: 4/30/2024 |