|
Download Data (XLS File) |
|
||||||||
|
||||||||
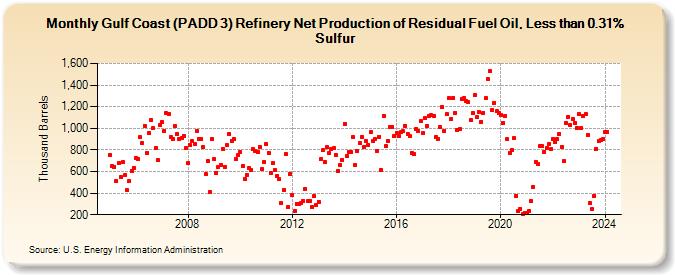
| Gulf Coast (PADD 3) Refinery Net Production of Residual Fuel Oil, Less than 0.31% Sulfur (Thousand Barrels) | ||||||||
| Year | Jan | Feb | Mar | Apr | May | Jun | Jul | Aug | Sep | Oct | Nov | Dec |
|---|---|---|---|---|---|---|---|---|---|---|---|---|
| 2005 | 753 | 649 | 642 | 511 | 681 | 548 | 685 | 571 | 425 | 508 | 608 | 636 |
| 2006 | 726 | 715 | 915 | 861 | 1,022 | 769 | 952 | 1,077 | 1,005 | 819 | 708 | 1,027 |
| 2007 | 1,059 | 976 | 1,137 | 1,131 | 917 | 898 | 1,020 | 948 | 904 | 909 | 929 | 816 |
| 2008 | 677 | 842 | 878 | 854 | 975 | 901 | 899 | 825 | 573 | 693 | 412 | 901 |
| 2009 | 712 | 588 | 644 | 661 | 807 | 646 | 842 | 945 | 887 | 904 | 720 | 749 |
| 2010 | 780 | 648 | 528 | 571 | 632 | 612 | 808 | 790 | 780 | 830 | 619 | 691 |
| 2011 | 854 | 773 | 587 | 678 | 614 | 561 | 528 | 306 | 429 | 762 | 276 | 575 |
| 2012 | 379 | 234 | 302 | 296 | 304 | 329 | 436 | 324 | 326 | 272 | 372 | 292 |
| 2013 | 320 | 712 | 795 | 690 | 823 | 771 | 804 | 817 | 756 | 605 | 661 | 710 |
| 2014 | 1,042 | 747 | 781 | 784 | 918 | 659 | 794 | 862 | 923 | 831 | 878 | 847 |
| 2015 | 965 | 881 | 903 | 793 | 923 | 612 | 1,114 | 836 | 886 | 1,013 | 1,013 | 928 |
| 2016 | 952 | 930 | 963 | 971 | 1,024 | 951 | 925 | 772 | 760 | 995 | 976 | 1,065 |
| 2017 | 955 | 1,092 | 1,021 | 1,113 | 1,120 | 1,117 | 917 | 905 | 1,010 | 1,199 | 976 | 1,130 |
| 2018 | 1,276 | 1,084 | 1,284 | 1,146 | 984 | 992 | 1,272 | 1,280 | 1,252 | 1,243 | 1,077 | 1,141 |
| 2019 | 1,305 | 1,101 | 1,155 | 1,062 | 1,145 | 1,277 | 1,454 | 1,528 | 1,170 | 1,238 | 1,156 | 1,145 |
| 2020 | 1,126 | 1,051 | 1,116 | 898 | 769 | 801 | 907 | 376 | 231 | 253 | 206 | 220 |
| 2021 | 216 | 235 | 324 | 460 | 688 | 670 | 833 | 832 | 782 | 815 | 850 | 804 |
| 2022 | 902 | 870 | 900 | 950 | 829 | 697 | 1,050 | 1,107 | 1,031 | 1,085 | 1,052 | 1,004 |
| 2023 | 1,129 | 1,002 | 1,114 | 1,129 | 941 | 304 | 254 | 377 | 811 | 879 | 889 | 900 |
| 2024 | 964 | |||||||||||
| - = No Data Reported; -- = Not Applicable; NA = Not Available; W = Withheld to avoid disclosure of individual company data. |
| Release Date: 3/29/2024 |
| Next Release Date: 4/30/2024 |