|
Download Data (XLS File) |
|
||||||||
|
||||||||
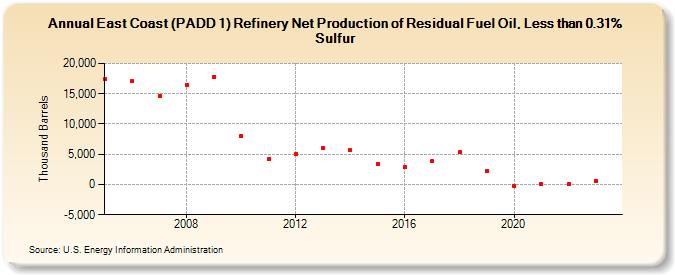
| East Coast (PADD 1) Refinery Net Production of Residual Fuel Oil, Less than 0.31% Sulfur (Thousand Barrels) | ||||||||
| Decade | Year-0 | Year-1 | Year-2 | Year-3 | Year-4 | Year-5 | Year-6 | Year-7 | Year-8 | Year-9 |
|---|---|---|---|---|---|---|---|---|---|---|
| 2000's | 17,391 | 17,099 | 14,598 | 16,517 | 17,780 | |||||
| 2010's | 7,951 | 4,171 | 5,044 | 6,005 | 5,637 | 3,454 | 2,899 | 3,856 | 5,287 | 2,207 |
| 2020's | -178 | 29 | 38 | 648 |
| - = No Data Reported; -- = Not Applicable; NA = Not Available; W = Withheld to avoid disclosure of individual company data. |
| Release Date: 3/29/2024 |
| Next Release Date: 8/30/2024 |