|
Download Data (XLS File) |
|
||||||||
|
||||||||
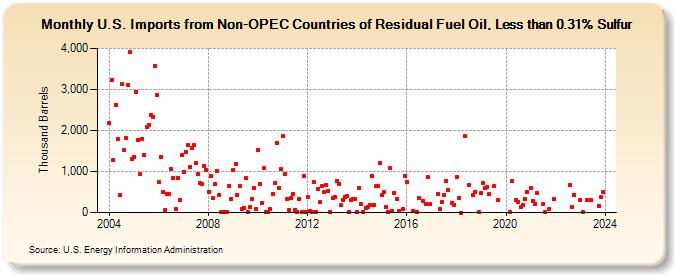
| U.S. Imports from Non-OPEC Countries of Residual Fuel Oil, Less than 0.31% Sulfur (Thousand Barrels) | ||||||||
| Year | Jan | Feb | Mar | Apr | May | Jun | Jul | Aug | Sep | Oct | Nov | Dec |
|---|---|---|---|---|---|---|---|---|---|---|---|---|
| 2004 | 2,180 | 3,229 | 1,281 | 2,631 | 1,781 | 420 | 3,121 | 1,516 | 1,812 | 3,108 | 3,901 | 1,302 |
| 2005 | 1,358 | 2,938 | 1,772 | 928 | 1,795 | 1,398 | 2,089 | 2,123 | 2,372 | 2,329 | 3,575 | 2,861 |
| 2006 | 750 | 1,352 | 501 | 65 | 460 | 448 | 1,059 | 841 | 80 | 836 | 314 | 1,396 |
| 2007 | 992 | 1,476 | 1,650 | 1,116 | 1,565 | 1,640 | 1,202 | 937 | 723 | 684 | 1,138 | 1,028 |
| 2008 | 509 | 890 | 345 | 697 | 1,013 | 433 | 10 | 10 | 10 | 13 | 655 | 337 |
| 2009 | 1,048 | 1,186 | 425 | 652 | 87 | 113 | 836 | 9 | 139 | 337 | 610 | 90 |
| 2010 | 1,527 | 696 | 230 | 1,081 | 9 | 7 | 77 | 447 | 727 | 1,694 | 608 | 1,051 |
| 2011 | 1,857 | 940 | 324 | 57 | 348 | 454 | 74 | 19 | 336 | 4 | 885 | 22 |
| 2012 | 369 | 27 | 9 | 733 | 4 | 584 | 247 | 647 | 493 | 677 | 531 | 4 |
| 2013 | 348 | 370 | 771 | 705 | 177 | 307 | 375 | 403 | 3 | 305 | 336 | 322 |
| 2014 | 5 | 600 | 210 | 2 | 103 | 142 | 189 | 896 | 177 | 642 | 657 | 1,196 |
| 2015 | 433 | 489 | 140 | 7 | 1,080 | 46 | 472 | 337 | 31 | 90 | 900 | |
| 2016 | 746 | 40 | 18 | 347 | 291 | 203 | 868 | 199 | ||||
| 2017 | 456 | 85 | 252 | 431 | 763 | 549 | 243 | 196 | ||||
| 2018 | 871 | 361 | 1 | 1,867 | 673 | 421 | 497 | 2 | ||||
| 2019 | 468 | 728 | 596 | 631 | 445 | 647 | 299 | |||||
| 2020 | 8 | 770 | 316 | 261 | 132 | 181 | 338 | 511 | ||||
| 2021 | 599 | 292 | 200 | 465 | 208 | 2 | 96 | 320 | ||||
| 2022 | 676 | 145 | 438 | |||||||||
| 2023 | 305 | 11 | 313 | 305 | 171 | 370 | 491 | |||||
| - = No Data Reported; -- = Not Applicable; NA = Not Available; W = Withheld to avoid disclosure of individual company data. |
| Release Date: 3/29/2024 |
| Next Release Date: 4/30/2024 |