|
Download Data (XLS File) |
|
||||||||
|
||||||||
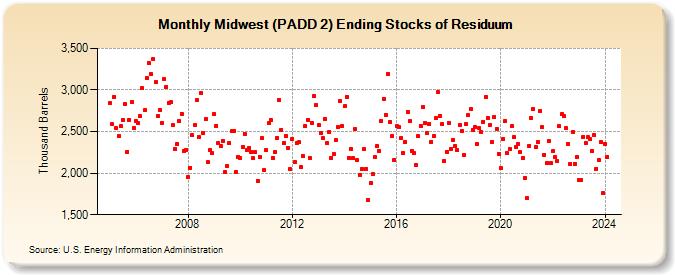
| Midwest (PADD 2) Ending Stocks of Residuum (Thousand Barrels) | ||||||||
| Year | Jan | Feb | Mar | Apr | May | Jun | Jul | Aug | Sep | Oct | Nov | Dec |
|---|---|---|---|---|---|---|---|---|---|---|---|---|
| 2005 | 2,838 | 2,590 | 2,920 | 2,538 | 2,449 | 2,561 | 2,643 | 2,830 | 2,258 | 2,643 | 2,857 | 2,544 |
| 2006 | 2,626 | 2,598 | 2,685 | 3,021 | 2,754 | 3,145 | 3,323 | 3,192 | 3,369 | 3,090 | 2,688 | 2,763 |
| 2007 | 2,608 | 3,126 | 3,037 | 2,846 | 2,851 | 2,574 | 2,289 | 2,352 | 2,623 | 2,717 | 2,268 | 2,282 |
| 2008 | 1,949 | 2,066 | 2,455 | 2,575 | 2,875 | 2,433 | 2,968 | 2,483 | 2,651 | 2,131 | 2,281 | 2,242 |
| 2009 | 2,714 | 2,572 | 2,363 | 2,325 | 2,387 | 2,008 | 2,082 | 2,362 | 2,503 | 2,507 | 2,016 | 2,199 |
| 2010 | 2,180 | 2,314 | 2,471 | 2,276 | 2,302 | 2,253 | 2,180 | 2,252 | 1,906 | 2,199 | 2,421 | 2,038 |
| 2011 | 2,278 | 2,597 | 2,640 | 2,186 | 2,257 | 2,423 | 2,877 | 2,524 | 2,359 | 2,448 | 2,307 | 2,047 |
| 2012 | 2,415 | 2,133 | 2,358 | 2,369 | 2,069 | 2,207 | 2,564 | 2,644 | 2,182 | 2,606 | 2,929 | 2,817 |
| 2013 | 2,575 | 2,479 | 2,420 | 2,651 | 2,362 | 2,497 | 2,179 | 2,231 | 2,397 | 2,557 | 2,862 | 2,565 |
| 2014 | 2,802 | 2,917 | 2,184 | 2,291 | 2,178 | 2,530 | 2,156 | 1,973 | 2,050 | 2,288 | 2,054 | 1,672 |
| 2015 | 1,884 | 1,991 | 2,192 | 2,321 | 2,264 | 2,628 | 2,895 | 2,703 | 3,196 | 2,618 | 2,448 | 2,155 |
| 2016 | 2,565 | 2,557 | 2,421 | 2,239 | 2,376 | 2,739 | 2,624 | 2,264 | 2,242 | 2,101 | 2,443 | 2,571 |
| 2017 | 2,798 | 2,604 | 2,477 | 2,595 | 2,379 | 2,446 | 2,664 | 2,970 | 2,692 | 2,593 | 2,145 | 2,259 |
| 2018 | 2,608 | 2,293 | 2,400 | 2,326 | 2,273 | 2,579 | 2,509 | 2,214 | 2,586 | 2,694 | 2,766 | 2,522 |
| 2019 | 2,551 | 2,355 | 2,537 | 2,490 | 2,618 | 2,920 | 2,668 | 2,584 | 2,379 | 2,674 | 2,533 | 2,235 |
| 2020 | 2,056 | 2,409 | 2,630 | 2,238 | 2,290 | 2,565 | 2,433 | 2,311 | 2,353 | 2,253 | 2,184 | 1,946 |
| 2021 | 1,698 | 2,330 | 2,662 | 2,770 | 2,311 | 2,372 | 2,745 | 2,551 | 2,224 | 2,120 | 2,384 | 2,118 |
| 2022 | 2,269 | 2,194 | 2,140 | 2,563 | 2,706 | 2,682 | 2,542 | 2,354 | 2,111 | 2,493 | 2,113 | 2,193 |
| 2023 | 1,918 | 1,913 | 2,440 | 2,366 | 2,429 | 2,408 | 2,262 | 2,460 | 2,054 | 2,156 | 2,375 | 1,758 |
| 2024 | 2,348 | |||||||||||
| - = No Data Reported; -- = Not Applicable; NA = Not Available; W = Withheld to avoid disclosure of individual company data. |
| Release Date: 3/29/2024 |
| Next Release Date: 4/30/2024 |